Join us for Raise Your Voice on September 10!
Research & Data
2025 Kids Count Report
The Kids Count in Nebraska Report is our state’s most comprehensive resource on child well-being. By looking at key areas like population, health, education, economic stability, child welfare, and juvenile justice, the report provides Voices for Children in Nebraska with a clearer picture of what kids need to lead healthy, secure, and fulfilling lives.
Sponsored by the Annie E. Casey Foundation, KIDS COUNT ® is a national and state-by-state effort to track the status of children in the United States.
Explore the data and insights that drive our vision for stronger communities across the state.
Commentary
Child Food Insecurity in Nebraska: Where We Stand and What We Can Do
Every child should have consistent access to the nutritious food required to learn, play, and develop a healthy mind and body. Unfortunately, many families struggle to secure the food their children need to gain a good start in life. The most recent available data reveal that 19.2% of children in Nebraska are food insecure, meaning they lack the consistent access to the nutritious food required to live an active, healthy life.1 Which children are more prone to struggle with food insecurity? How can so many children be food insecure? What can be done to reduce food insecurity? The sections below present data that begin to answer these questions. Fortunately, modern food production methods produce more than enough food to feed everyone. The challenge is ensuring children have access to nutritious food when they need it. Doing so will require adequate income opportunities for parents and effective social protection policies and programs to fill the gaps.
Food Insecurity: What the Data Say
The United States Department of Agriculture (USDA) distinguishes between low and very low food security. Low food security refers to reduced quality, variety, or desirability of diet, while very low food security refers to disrupted eating patterns and reduced food intake.2 Households experiencing low food security typically rely on cheap foods lacking nutritious value and therefore suffer from malnutrition whereas households defined as very low food security suffer from hunger and malnutrition. Both forms of food insecurity are linked to poorer physical and mental health, and lower academic and economic outcomes. Whereas children living in very low food security households are prone to be underweight, those in low security households are at a higher risk of conditions such as obesity and diabetes due to the reliance on cheaper, non-nutritious foods.3 The most recent data show that 12.9% of U.S. households with children experienced low food security and additional 5.4% experienced very low food security.4 Despite ample national resources, nearly 20% of children in our country are missing out on critical nutrition their growing bodies and minds need in order to thrive.
Figure 1. U.S. Food Insecurity Rates Higher Among Households with Children (2001-2024)
Source: USDA, Household Food Security in the United States in 2024
As Figure 1 shows, food insecurity rates are historically higher among households with children. In 2024, 18.4% of households with children were food insecure, compared to 13.7% of all households. Figure 1 also shows how food insecurity rates fluctuated in the first quarter of this century, rising and falling depending on macroeconomic trends and policy interventions. Food insecurity among households with children peaked due to the 2008 financial crisis and the ensuing Great Recession, with the highest rate this century occurring in 2009 at 21.3%. Rates remained above 20% through 2012 and continued declining until 2019 when they stood at 13.6%. With the onset of the Covid-19 pandemic, rates began rising again with the exception of a momentary dip in 2021 when, remarkably, rates among households with children were the lowest of thecentury at 12.5%. The USDA attributes this momentary dip to the expansion of both the Child Tax Credit and of federal nutrition assistance programs.5 Congress failed to extend those expanded supports, however, and food insecurity rates for households with children began rising again, reaching 18.4% in 2024, the last year with available data.
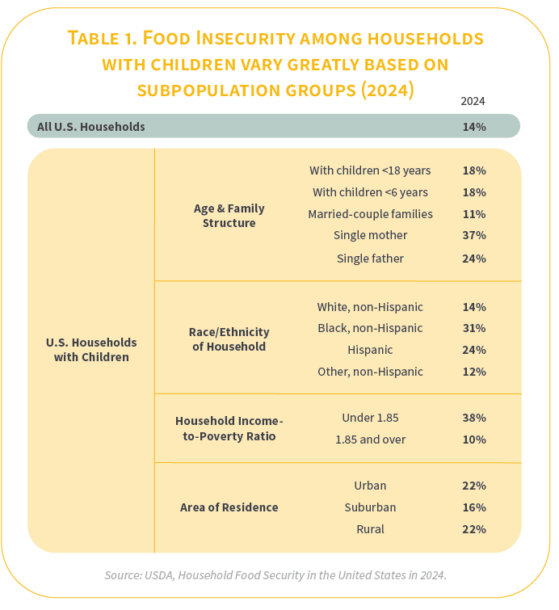
Among U.S. households with children, certain demographic groups are more likely than others to struggle with food insecurity. As Table 1 shows, children growing up in single-parent households are more likely to experience food insecurity, with 36.8% of single mothers and 22.6% of single fathers doing so, compared to 10.9% of married-couples.
Black households with children had a 31.0% food insecurity rate, the highest among race/ethnicity groups with data. Children in Hispanic households had a 23.8% rate, while white, non-Hispanic households had a 14.1% rate.
Perhaps unsurprisingly, the highest rate of food insecurity occurred among households with income under 185% of the federal poverty line (FPL), at 38.3%. However, food insecurity is not limited to these families as 8.7% of households with incomes 185% or higher of the FBL were food insecure in 2024.
Geographically, 21.7% of rural households with children experienced food insecurity, while 21.5% of urban households with children did so. Children in suburban households had the lowest rates at 16.2%.
Figure 2 maps child food insecurity rates by county in our state. The counties with the highest food insecurity rates were Blaine (28.5%), Dundy (27.0%), Franklin (25.6%), and Sioux (25.2%), all rural counties. In the most populous county in Nebraska, Douglas, 19.9% of children are food insecure, while the mostly suburban county of Sarpy registered one of the lowest rates in the state at 15.3%. The lowest rate of food insecurity among children in Nebraska occurred in Colfax County at 13.5%. In all, child hunger is not just an urban problem, but is experienced by children in every corner of Nebraska.
In Nebraska, food deserts are a significant and growing issue, especially in rural areas that are losing population. Research shows that 48 of Nebraska’s 93 counties have census tracts designated as food deserts. Of those 48 counties, 46 experienced population decline from 2020 to 2022. These declines in population make it difficult for grocery stores to remain in business, as there has been a 30% decline in rural grocery stores, forcing families to travel long distances for food.6 Even in more populated areas, access gaps persist. For example, in the Omaha metro area, about 9 percent of residents live in food deserts, which is more than double the national rate of around 4 percent.7 Overall, these patterns show that despite Nebraska’s strong economy, many families still struggle to consistently access healthy, affordable food close to home.
Figure 2. Nebraska Child Food Insecurity Rates by County (2023)
- N/A
- Below 18
- 18.0-19.9
- 20.0.0-21.9
- 22.0+
Source: Feeding America Map the Meal Gap, Child Food Insecurity in Nebraska 2023.
Causes of Food Insecurity
Food insecurity occurs when family budgets cannot cover all basic expenses and painful choices between shelter, food, transportation, health care, and child care must be made. Despite adequate economic resources and food supplies at the aggregate levels, inequities in pay and job opportunities cause many households to lack the money required to cover the costs of raising children. As data above revealed, U.S. households with children earning less than 185% of the FPL are more likely to experience food insecurity. For a married couple with two children, 185% of the FPL is $57,720, while for a single parent with two children it is $47,767. Many jobs in the labor market, especially in service sector fields such as retail, health care, education, accommodation and food services, do not meet these income thresholds. Scholars have long noted a growing proportion of jobs are in the service sector, jobs that also tend to have lower pay, few or no benefits, poor job security, and fewer chances of promotion. At the same time, the emergence of a white collar, professional and managerial class that receive higher wages, greater job security, more benefits, and more opportunities for promotion has also emerged. While those two classes of workers have grown over time, agricultural jobs and jobs traditionally known as blue collar and having solid pay and strong job stability, have declined as a proportion of the total labor market.8
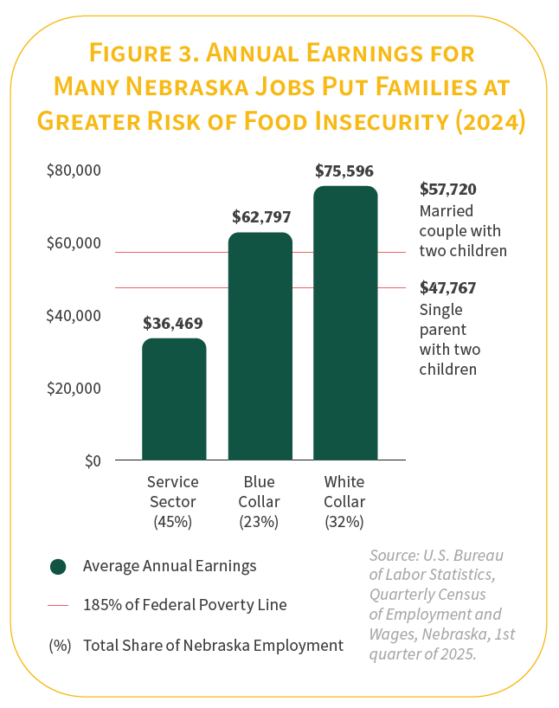
Figure 3 shows the proportion of white collar, blue collar, and service sector jobs in Nebraska, along with the average earnings (wages and benefits) per employee in the first quarter of 2025.9 In line with national trends, the service sector accounts for the most jobs at 45% but workers in this sector take in the smallest earnings at an average of $36,469 annually. Blue collar jobs account for 23% of employment and fare better financially at an average of $62,797 annual earnings. White collar jobs account for 32% of employment and bring in the best average annual earnings at $75,596.
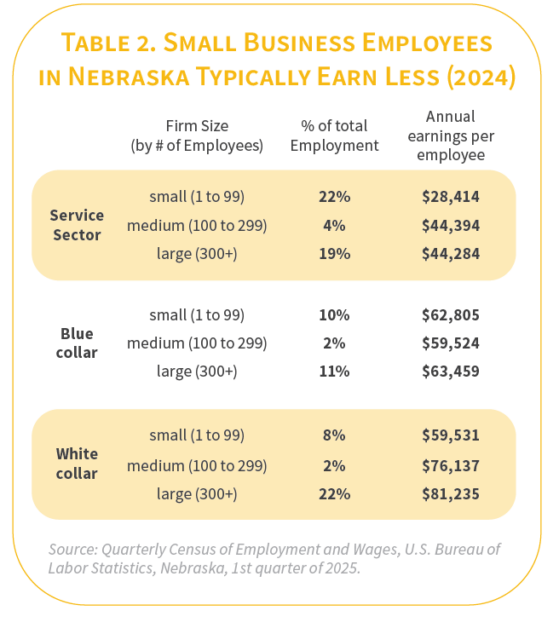
Differences between the class of workers are more pronounced when considering the size of the business employing the workers. Table 2 breaks the employment sector earnings data down by the size of the business. Service workers employed by small businesses (1 to 99 employees) account for 22% of workers in the state of Nebraska, but bring in annual earnings on average of $28,414, while service workers employed by large businesses (300+ employees) do better at $44,284 in yearly earnings. The earnings of blue-collar workers were consistent across the size of business employing them, but white-collar workers experienced more variation. White collar workers earned $59,531 at small businesses, $76,137 at medium-sized businesses, and $81,235 at large businesses.
These earnings may be enough to support an individual, but for parents they often fail to cover the full expense of raising a family, forcing households with children to make tough decisions that often come at the expense of food quality and quantity. Together, these findings point to the need for policy interventions that ensure access to nutritious food for all children.
Addressing Child Food Insecurity
Families have limited budgets. Any actions that increase wages among the lowest earners or bring down the cost of major budget items such as housing, health care, child care, transportation, or food would help reduce hunger and malnutrition among children. Space does not allow us to address all these issues, but a brief comment on wage inequities and job opportunities is necessary before addressing food specific safety net programs.
Efforts to attach work requirements on nutrition programs are unlikely to spur more Nebraskans to work and advance their careers. Nebraskans are hardworking people who, in general, are already taking the job opportunities available to them in a strong labor market. In 2025, the unemployment rate in Nebraska was 3.2%, lower than the national average of 4.3%.10 Unemployment rates, however, only measure unemployment among people who are actively looking for employment and may hide many discouraged workers who have given up on looking for work. Labor participation rates account for this by measuring how much of the adult population is working. Nebraska’s labor force participation rate is 69.9%, the highest in the nation.11 Labor force participation rates are even higher among parents. In Nebraska, 95.6% of children have at least one parent in the workforce, higher than the national rate of 93.3%. Nebraska also has a higher rate of children with all available parents in the labor force, 77.6% compared to the national rate of 71.3%.
Despite these high labor force participation rates and low unemployment rates, Nebraska’s child food insecurity rate was the same as the national rate at 19.2%.12 It seems doubtful, then, that Nebraska needs to simply emphasize more labor force participation. Parents are already working, but, as the wage-earning data in Figure 3 and Table 2 shows, work is not paying enough. It was from this experience that working Nebraskans voted for ballot initiates to raise the minimum wage to $15/hour beginning in 2026 and another initiative for paid sick leave, which took effect late in 2025. These measures are small steps to enlarge family budgets and help shield working parents from the loss of wages when they or their family members are sick.
Despite those steps, food insecurity in Nebraska will persist as businesses, especially small businesses in the service sector, struggle to provide adequate wages, benefit packages, or job security. Safety net programs are a crucial policy lever for filling the gaps for families earning low-wages, getting inconsistent hours, and/or those most vulnerable to swings in labor market conditions.
Several vital federal food programs exist for just this purpose. Programs such Supplemental Nutrition Assistance Program (SNAP), Women, Infants, and Children (WIC), and school meal programs help low-income families purchase meals and food. In addition, tax breaks, such as the Child Tax Credit, are effective at targeting families with children and putting more money in their pockets, giving them the flexibility to spend money where they see best fit.
While these programs and tax breaks have existed for several years, they are not always adequately funded or place administrative burdens on potential recipients that prevent access. Currently, parents or guardians must earn below 130% of the FPL for their children to be eligible for free school meals, while reduced price school eligibility is capped at 185% FPL. SNAP and WIC eligibility are capped at 165% and 185% of the FPL, respectively. However, this does not mean all families meeting those income thresholds receive the benefits. For example, only 34% of Nebraska households in poverty were on SNAP, much lower than the national rate of 41%, suggesting that administrative barriers are preventing many families in the U.S., and especially Nebraska, from obtaining the help they need.
Even though these programs have not eliminated food insecurity, we know they are effective at helping families and children. The recent government shutdown in November of 2025 provides proof of this. As the government shutdown prolonged throughout the month, SNAP beneficiaries across the country did not receive their benefits. From January through October of 2025, the U.S. household food insecurity rate among SNAP recipients was 36%. When benefits did not reach households in November, the food insecurity rate jumped to 46%.
School meal programs are another critical nutrition support for families. In the 2024-25 school year, nearly 9 million free breakfasts and over 18 million free lunches were served in Nebraska schools, while another nearly 900,000 reduced price breakfasts and 2.5 million reduced price lunches were served.13 For many children, school meals contain the most nutritious food they will consume in a day. Participation in school meal programs is linked to numerous health and educational benefits, including greater food security, better diet quality, improved physical and mental health, higher attendance rates, and stronger academic performance.14
Further proof of the effectiveness of tax credits and federal nutrition programs was seen in 2021, when the National School Lunch Program (NSLP) allowed schools to provide free meals to anyone in need and the Child Tax Credit increased from $2,000 per qualifying child to $3,600 for children under the age of 6 and $3,000 for children ages 6 to 17.
The expanded Child Tax Credit distributed payments monthly, giving families consistent financial support throughout the year. Unlike SNAP benefits, the tax credit provided unconditional cash assistance, allowing families the agency and flexibility to determine where the cash needed to be spent each month. Research found that families primarily used the payments on basic needs like food, housing, transportation, and childcare.15
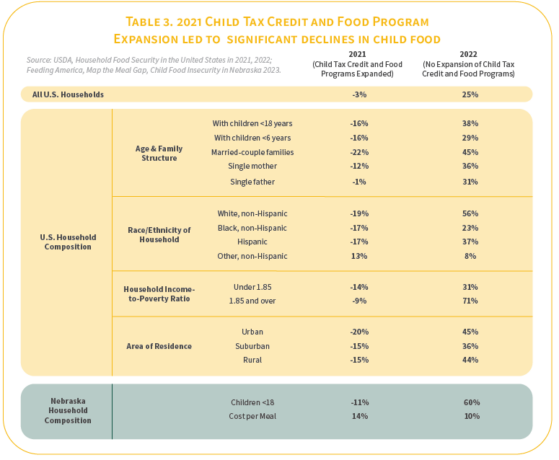
As seen in Table 3, these efforts helped reduce food insecurity among U.S. households with children by 16%, the largest drop in U.S. child food insecurity rates this century. In Nebraska, child food insecurity rates dropped 11%. However, once those supports were reduced back to their previous levels in 2022, U.S. food insecurity among households with children rose 38%, the largest yearly increase this century. In Nebraska, child food insecurity rose 60% from 2021 to 2022. It is true that food prices were rising in 2022 and, as a result, we would expect food insecurity rates to increase.16 However, according to Feed America, the cost per meal in Nebraska rose more in 2021 than in 2022, at 14% and 10% respectively. The better explanation for the increase in food insecurity from 2021 to 2022 is the loss of direct support for families.
Based on what the data say and what we know works, we recommend solutions that address the root cause of child hunger, expand access to food year-round, and reduce administrative barriers and increase enrollment in existing nutrition programs.
To address the root causes of child hunger, it is necessary to increase family economic stability through policies that:
• Raise wages and expand access to stable employment.
• Strengthen refundable tax credits like the Child Tax Credit and Earned Income Tax Credit.
• Expand affordable housing access to reduce cost burdens that force families to choose between rent and food.
To expand access to food year-round:
• Extend and increase Summer Electronic Benefits Transfer to ensure children who rely on school meals continue receiving nutrition support during summer and school breaks.
• Expand access to school meals by adopting policies that move Nebraska closer to universal free school meals, reducing stigma and ensuring all children can eat regardless of family income.
• Increase participation in afterschool and out-of-school meal programs, particularly in rural and underserved communities where access gaps are largest.
To reduce administrative barriers and increase enrollment:
• Implement express lane eligibility and data-sharing between programs like Medicaid, SNAP, and school meals to automatically enroll eligible children.
• Simplify application and recertification processes across programs to reduce gaps in benefits.
• Invest in community-based navigators and outreach, particularly for youth aging out of foster care, families experiencing homelessness, and immigrant and mixed-status households.
Conclusion
Policy choices matter and in 2021 the expansion of already existing nutrition programs and tax credits worked for families and their children. The data presented here show that even in a strong labor market, many working parents cannot earn enough to meet the full cost of raising a family. Programs such as SNAP, WIC, free and reduced school meals, and the Child tax Credit have proven their ability to reduce food insecurity, improve child health, and support educational outcomes when adequately funded and accessible. At the same time, the sharp rise in food insecurity following the rollback of expanded supports demonstrates how quickly progress can be reversed when these policies are weakened.
Addressing child food insecurity requires an approach that encourages strong wage growth, reduces costs burdens, and makes existing safety net programs more accessible. Expanding access to nutrition programs and building on successful past policy experiments, such as the Child Tax Credit, would ensure more children have an equal opportunity to grow and develop physically, mentally, and emotionally. The lack of food to go around is not the problem. We have the food. We have the resources. We have knowledge of what works. We have the choice: do we or do we not take the steps necessary to ensure all children in Nebraska are food secure?
End Notes
1. Map the Meal Gap, Food Insecurity among the Child Population in the United States, https://map.feedingamerica.
org/county/2023/child.
2. Matthew Rabbitt, Madeline Reed-Jones, Laura J. Hales, Shellye Suttles, Michael P. Burke. “Household food security
in the United States in 2024.” US Department of Agriculture, Economic Research Service (2025); “Food security
in the U.S.-Definitions of food security.” Economic research service. U.S. department of agriculture. February 18,
2025, https://www.ers.usda.gov/topics/food-nutrition-assistance/food-security-in-the-us.
3. Shankar Priya, Rainjade Chung, and Deborah A. Frank. “Association of food insecurity with children’s behavioral,
emotional, and academic outcomes: a systematic review.” Journal of Developmental & Behavioral Pediatrics
38, no. 2 (2017): 135-150; Thomas, Margaret MC, Daniel P. Miller, and Taryn W. Morrissey. “Food insecurity and
child health.” Pediatrics 144, no. 4 (2019); United Nations Children’s Fund (UNICEF), Feeding Profit. How food
environments are failing children. Child Nutrition Report 2025, UNICEF, New York, September 2025; Wylie-Rosett,
Judith, and Linda A. DiMeglio. “Strategies to reduce food insecurity for people with diabetes: a call to action.”
Diabetes care 46, no. 2 (2023): 245.
4. Matthew Rabbitt, Madeline Reed-Jones, Laura J. Hales, Shellye Suttles, Michael P. Burke. “Household food security
in the United States in 2024.” US Department of Agriculture, Economic Research Service (2025).
5. Laura J. Hales, Alisha Coleman-Jensen. “Food insecurity decreased for U.S. households with children in 2021, but
increased for households without children.” Economic research service. U.S. department of agriculture. November
17, 2022, https://www.ers.usda.gov/amber-waves/2022/november/food-insecurity-decreased-for-u-s-householdswith-
children-in-2021-but-increased-for-households-without-children
6. McKee, Gregory J. & Kaskie, Shawn C. “Food deserts in Nebraska: A revised methodology and analysis”. (2024).
https://www.cfra.org/sites/default/files/publications/Food%20Deserts%20in%20Nebraska.pdf.
7. Omaha Community Foundation. “Omaha’s food deserts: Who has access to healthy foods, September
28, 2022. https://omahafoundation.org/news/omahas-food-deserts-who-has-access-to-healthyfoods/#:~:
text=According%20to%20the%20Omaha%20Community%20Foundation,%20Omaha,Omaha%20*%20
Western%20portions%20of%20Council%20Bluffs
8. Florida, Richard. The new urban crisis: How our cities are increasing inequality, deepening segregation, and failing
the middle class-and what we can do about it. Basic books, 2017; Sassen, Saskia. The Global City: New York,
London, Tokyo. Princeton University Press, 2013; Ehrenreich, Barbara, and John Ehrenreich. “The professionalmanagerial
class.” Between labor and capital 45 (1979); Larson, Magali Sarfatti. “The rise of professionalism: A
sociological analysis.” Class: The Anthology (2017): 263-286.
9. Agriculture jobs were not included due to incomplete data.
10. Alternative Measures of Labor Underutilization for States, U.S. Bureau of Labor Statistics, January 30, 2026, https://
www.bls.gov/lau/stalt.htm.
11. U.S. Bureau of Labor Statistics, Region, Division, and State Labor Force Participation Rates with Confidence
Intervals, Their Relationships to the U.S. Rate, and Over-the-Month Rate Changes with Significance Indicators,
December 2025, Seasonally Adjusted.
12. Map the Meal Gap, Food Insecurity among the Child Population in the United States, https://map.feedingamerica.
org/county/2023/child.
13. Nebraska Department of Education, https://nep.education.ne.gov/#/profiles/state/snapshot?dataYears=20242025.
14. Hartline-Grafton H, Levin M. Breakfast and School-Related Outcomes in Children and Adolescents in the US:
A Literature Review and its Implications for School Nutrition Policy. Curr Nutr Rep. 2022;11(4):653-664; Cohen
JFW, Hecht AA, McLoughlin GM, Turner L, Schwartz MB. Universal School Meals and Associations with Student
Participation, Attendance, Academic Performance, Diet Quality, Food Security, and Body Mass Index: A Systematic
Review. Nutrients. 2021;13(3):911.
15. Columbia University Center on Poverty and Social Policy. Child Tax Credit Research Roundup. New York: Columbia
University, 2021.
16. Nord, M., Coleman-Jensen, A., & Gregory, C. A. Prevalence of U.S. Food Insecurity is Related to Changes in
Unemployment, Inflation, and the Price of Food (Economic Research Report No. 167). U.S. Department of
Agriculture, Economic Research Service, (2014). https://www.ers.usda.gov/publications/pub-details?pubid=45216.
Population
The premise of Kids Count is and has always been that good data can help drive good decisions. Without knowing where children, families, and our communities stand now, we cannot know where the most effective solutions lie. The U.S. Census, taken every 10 years, and the American Community Survey, taken every year, are two of the most important tools for learning how communities are faring. Utilizing these tools, the following section provides a demographic snapshot of Nebraska.
Nebraska Total Resident Population (1980 – 2024)
2,005,465
people lived in Nebraska in 2024.1
484,312
children under age 18 lived in Nebraska in 2024.2
24.9%
of Nebraskans were of color in 2024.3 This is expected to increase to 38% by 2050.4
Sources:
1 U.S. Census Bureau, Population Division, Annual Population Estimates.
2 U.S. Census Bureau, Population Division, Annual Estimates of the Resident Population by Single Year of Age and Sex for Nebraska: April 1, 2020 to July 1, 2024.
3 U.S. Census Bureau, Annual Estimates of the Resident Population by Age, Sex, Race, and Hispanic Origin for Nebraska: April 1, 2020 to July 1, 2024.
4 Center for Public Affairs Research (CPAR) and Office of Latino/Latin American Studies (OLLAS), UNO, Nebraska Population Projections to 2050 and Implications.
Nebraska population by race/ethnicity (2024)
Source: U.S. Census Bureau, Annual Estimates of the Resident Population by Age, Sex, Race, and Hispanic Origin for Nebraska: April 1, 2020 to July 1, 2024.
Nebraska Rurality Classification (2024)
- The Big 3 Counties
- Other metropolitan counties
- Micropolitan counties with a city between 10,000 and 49,999 residents
- Nonmetropolitan counties that have a city between 2,500 and 9,999 residents
- Nonmetropolitan counties that do not have a city >2,500 residents
Source: U.S. Census Bureau, Population Division, Annual Estimates of the Resident Population for Incorporated Places in Nebraska: April 1, 2020 to July 1, 2024.
Nebraska Population by Rurality Classification (2024)
Source: U.S. Census Bureau, Annual Estimates of the Resident Population by Age, Sex, Race, and Hispanic Origin for Nebraska: April 1, 2020 to July 1, 2024.
56.8%
of Nebraska children lived in the “Big 3” counties in 2024.1
17.4%
of Nebraskans were 65 or older in 2024. This is expected to increase to 21.0% by 2050.2
Source:
1 U.S. Census Bureau, Population Division, Annual Estimates of the Resident Population for Incorporated
Places in Nebraska: April 1, 2020 to July 1, 2024.
2 Center for Public Affairs Research, UNO, Nebraska County Population Projections: 2010 to 2050.
Nebraska population by age (2024)
Source: U.S. Census Bureau, Population Division, Annual Estimates of the Resident Population by Single Year of Age and Sex for Nebraska: April 1, 2020 to July 1, 2024.
Nebraska children by age (2024)
Source: U.S. Census Bureau, Population Division, Annual Estimates of the Resident Population by Single Year of Age and Sex for Nebraska: April 1, 2020 to July 1, 2024.
Nebraska households with children by household type (2024)
Source: U.S. Census Bureau, 2024 American Community Survey 5-year Estimates, Table B09005
928
children lived in group quarters in 2024.1
3,603
children lived with their grandparent(s) without a parent present in 2024.2
3,334
children lived in non-family households in 2024.3
28.4%
of Nebraska children lived with an unmarried or single parent in 2024.4
Sources:
1 U.S. Census Bureau, 2024 American Community Survey 5-year Estimates, Table B09001.
2 U.S. Census Bureau, 2024 American Community Survey 5-year Estimates, Table B10002.
3 U.S. Census Bureau, 2024 American Community Survey 5-year Estimates, Table B09010.
4 U.S. Census Bureau, 2024 American Community Survey 5-year Estimates, Table B09005.
Race & Opportunity Index
Nebraska was founded under values of opportunity and equality for all, but when looking at the data on Nebraska’s children and families, a harsher reality is uncovered – one of disparity and lack of equitable chance of future success and opportunity for children of color. In response to this, the Index of Race & Opportunity for Nebraska Children was created. A composite score of 13 indicators of child well-being was calculated to highlight disparities in opportunity and measure progress toward race equity and inclusion.
Health
• Children with health insurance coverage
• Babies born at normal birth rate (5.5 pounds or more)
Education
• 3 to 5 year-olds enrolled in school
• 3rd graders proficienct in English Language Arts
• Young Adults Ages 19 to 24 who are in school or working
Economic Stability
• Children living above the Federal Poverty Level
• Median family income
• Children living in households with no housing cost burden
Child Welfare
• Children not involved in the child welfare system
• State wards receiving in-home services
• Children with three or fewer out-of-home placements
Juvenile Justice
• Successfully completed diversion
• Youth not in juvenile detention facilities
7 Key Steps
Used to help advance and embed race equity and inclusion at all levels of policy creation
STEP 1
Establish an understanding of race equity and inclusion principles.
STEP 2
Engage affected populations and stakeholders.
STEP 3
Gather and analyze disaggregated data.
STEP 4
Conduct systems analysis of root causes of inequities.
STEP 5
Identify strategies and target resources to address root causes of inequities.
STEP 6
Conduct race equity impact assessment for all policies and decision making.
STEP 7
Continuously evaluate effectiveness and adapt strategies.
Overall Index Scores out of a Possible 100 (2024)
Source: In-house analysis.
Children with health insurance coverage (2024)
Source: U.S. Census Bureau, 2024 American Community Survey 5-year Estimates, Table C27001B-I.
Babies Born at Normal Birth Rate (5.5 pounds or more) (2024)
Source: National Center for Health Statistics, final natality data.
3 to 5-year olds enrolled in school (2023)
Source: U.S. Census Bureau, 2023 American Community Survey 5-year Estimates, Public Use Microdata Samples.
3rd graders proficient in English Language Arts (2023-24)
Source: Nebraska Department of Education.
Young Adults Ages 16 to 24 who are in school or working (2023)
Source: U.S. Census Bureau, 2023 American Community Survey 5-year Estimates, Public Use Microdata Samples.
Children living above the Federal Poverty Line (2024)
Source: U.S. Census Bureau, 2024 American Community Survey 5-year Estimates, Table B17001B-I.
Median family income (2024)
Source: U.S. Census Bureau, 2024 American Community Survey 5-year Estimates, Table B19113B-I.
Children living in households without housing cost burdens* (2023)
Source: U.S. Census Bureau, 2023 American Community Survey 5-year Estimates, Public Use Microdata Samples. *Cost-burdened households spend 30% or more of income on housing
Children not involved in the child welfare system [Rate/1000] (2024)
Source: Nebraska Department of Health and Human Services.
State Wards receiving in-home services (2024)
Source: Nebraska Department of Health and Human Services.
Children with three or fewer out-of-home placements (2024)
Source: Nebraska Department of Health and Human Services.
Youth successfully completing diversion (2024)
Source: Nebraska Administrative Office of Courts & Probation.
Youth not in juvenile detention facilities [Rate/1000] (2024)
Source: Douglas County Youth Center; Patrick J. Thomas Juvenile Justice Center; Lancaster County Detention Center; Northeast Nebraska Juvenile Services.
Health
Every child and family deserves access to affordable, quality physical and behavioral health care.
Quality and consistent preventive health care, beginning even before birth, gives children the best chance to grow up to be healthy and productive adults.
Children and families must be able to access and maintain affordable health insurance, and policies should maximize availabilty and robust investment in Medicaid and the Children’s Health Insurance Program. Our health care systems and policies should prioritize preventive services including immunization, developmental screenings, early intervention, and home visiting. Policies should promote timely and equitable access to a complete range of health care services within a healthly home and community-based environments for children and families across the lifespan.
Births
24,928
babies were born in 2024.
Source: Nebraska Department of Health and Human Services.
Trimester Prenatal Care Began (2024)
First Trimester
78.4%
Second Trimester
15.7%
Third Trimester
3.6%
None
1.3%
Unknown
1.0%
| First Trimester | 78.4% |
|---|---|
| Second Trimester | 15.7% |
| Third Trimester | 3.6% |
| None | 1.3% |
| Unknown | 1.0% |
Source: National Center for Health Statistics, final natality data
Births by Race/Ethnicity (2024)
Source: National Center for Health Statistics, final natality data.
Adequacy of prenatal care by race/ethnicity (2024)
Source: National Center for Health Statistics, final natality data.
Pre/Post-Natal Health
Tobacco Use (2024)
Source: National Center for Health Statistics. National Vital Statistics System.
Low Birth Weight (2024)
Source: National Center for Health Statistics. National Vital Statistics System.
Pregnancy Intendedness (2023)
Source: Nebraska Department of Health and Human Services.
Vitamin Use Prior to Pregnancy (2022)
Source: Nebraska Department of Health and Human Services.
Breastfeeding (2023)
Source: Nebraska Department of Health and Human Services.
11.3%
of new mothers in 2023 experienced postpartum depression symptoms related to their most recent pregnancy.
12.8%
of women in 2023 had depression during pregnancy.
Source: Nebraska Department of Health and Human Services
Teen Births & Sexual Behavior
Teen Births (2024)
Teen births continue to decline.
954
babies were born to teen mothers.
260
mothers were 10-17 years old
694
mothers were 18 or 19 years old
Source: Nebraska Department of Health and Human Services
Teen births by age (2009-2024)
Source: Nebraska Department of Health and Human Services
Teen births by age (2024)
Source: Nebraska Department of Health and Human Services
Teen Sexual Behavior (2021)
Ever had sexual intercourse
34.5%
Had sexual intercourse before age 13
2.5%
Had sexual intercourse with four or more people
10.4%
Had sexual intercourse in the past three months
26.8%
Drank alcohol or used drugs before last sexual intercourse
20.4%
Did not use condoms during last sexual intercourse
49.0%
Did not use any method to prevent pregnancy during last sexual intercourse
5.4%
| Ever had sexual intercourse | 34.5% |
|---|---|
| Had sexual intercourse before age 13 | 2.5% |
| Had sexual intercourse with four or more people | 10.4% |
| Had sexual intercourse in the past three months | 26.8% |
| Drank alcohol or used drugs before last sexual intercourse | 20.4% |
| Did not use condoms during last sexual intercourse | 49.0% |
| Did not use any method to prevent pregnancy during last sexual intercourse | 5.4% |
Source: Center for Disease Control and Prevention, Youth Risk Behavior Survey, 2021
*
children under 11 years old had HIV/AIDS.
8
children ages 12-19 had HIV/AIDS.
0
children with diagnosis of HIV or AIDS who have died from the disease.
*Data Suppressed
Source: Nebraska Department of Health and Human Services.
Number of sexually transmitted infections (STIs) among those 19 and under (2009-2024)
Source: Nebraska Department of Health and Human Services
Infant & Child Deaths
Cause of Infant Deaths (2024)
#
%
Maternal and perinatal
66
43.4%
Birth defects
40
26.3%
SIDS/SUDI
20
13.2%
Heart/Cardiovascular and Respiratory
9
5.9%
Accident or Violent Cause
3
2.0%
Prematurity
0
0%
Infection
5
3.3%
Other
9
5.9%
Total
152
| # | % | ||
|---|---|---|---|
| Maternal and perinatal | 66 | 43.4% | |
| Birth defects | 40 | 26.3% | |
| SIDS/SUDI | 20 | 13.2% | |
| Heart/Cardiovascular and Respiratory | 9 | 5.9% | |
| Accident or Violent Cause | 3 | 2.0% | |
| Prematurity | 0 | 0% | |
| Infection | 5 | 3.3% | |
| Other | 9 | 5.9% | |
| Total | 152 |
Source: Nebraska Department of Health and Human Services.
Infant Mortality Per 1,000 Births
Source: Nebraska Department of Health and Human Services.
Child Deaths, Ages 1-19 (2009-2024)
Source: Nebraska Department of Health and Human Services.
Cause of Child Deaths (2024)
#
%
Accidents
47
39.5%
Suicide
17
14.3%
Cancer
8
6.7%
Birth defects
8
6.7%
Homicide
5
4.2%
COVID-19
0
0%
Other
34
28.6%
Total
119
| # | % | ||
|---|---|---|---|
| Accidents | 47 | 39.5% | |
| Suicide | 17 | 14.3% | |
| Cancer | 8 | 6.7% | |
| Birth defects | 8 | 6.7% | |
| Homicide | 5 | 4.2% | |
| COVID-19 | 0 | 0% | |
| Other | 34 | 28.6% | |
| Total | 119 |
Source: Nebraska Department of Health and Human Services.
8 women
died due to a cause related to or aggravated by pregnancy or its management in 2022.
34.2
Maternal death rate per 100,000 population in 2022.
Source: Nebraska Department of Health and Human Services.
Health Insurance
Health Coverage for Kids 18 & Under by Type (2024)
#
%
Any
486,753
95.2%
Public
137,582
26.9%
Employer-based
277,884
54.3%
Direct-purchase
32,376
6.3%
More than one type
38,911
7.6%
None
24,749
4.8%
| # | % | ||
|---|---|---|---|
| Any | 486,753 | 95.2% | |
| Public | 137,582 | 26.9% | |
| Employer-based | 277,884 | 54.3% | |
| Direct-purchase | 32,376 | 6.3% | |
| More than one type | 38,911 | 7.6% | |
| None | 24,749 | 4.8% |
Source: U.S. Census Bureau, 2024 American Community Survey 5-year estimates, Table B27010
Medicaid/CHIP Eligibility by Category SFY 2024 (Monthly Average)
Source: Nebraska Medicaid Annual Report for State Fiscal Year 2024.
179,435
children were enrolled in Medicaid/ CHIP (SFY 2024, Monthly Average).
49.3%
of people eligible for Medicaid/CHIP were children (SFY 2024, Monthly Average).
18.2%
of Medicaid costs were made up by children (SFY 2024, Monthly Average).
Source: Nebraska Medicaid Annual Report for State Fiscal Year 2024
Medicaid/CHIP Expenses by Category SFY 2024 (Monthly Average)
Source: Nebraska Medicaid Annual Report for State Fiscal Year 2024.
Uninsured children by race/ethnicity (2024)
#
%
American Indian
489
6.8%
Asian/Pacific Islander
492
3.8%
African American
1,991
6.8%
Hispanic
9,656
9.6%
Multiracial/Other
9,265
8.4%
White, Non-Hispanic
11,134
3.4%
| # | % | ||
|---|---|---|---|
| American Indian | 489 | 6.8% | |
| Asian/Pacific Islander | 492 | 3.8% | |
| African American | 1,991 | 6.8% | |
| Hispanic | 9,656 | 9.6% | |
| Multiracial/Other | 9,265 | 8.4% | |
| White, Non-Hispanic | 11,134 | 3.4% |
Source: U.S. Census Bureau, 2024 American Community Survey 5-year Estimates, Table C27001B-I
Medicaid/CHIP Enrollment (July 2024)
Source: State Medicaid and CHIP Applications, Eligibility Determinations, and Enrollment Data
Health Services
Health professional shortage areas are designations that indicate a shortage of health care providers in the areas of primary care, mental health care, or dental health care. Shortages fall into 3 categories¹:
1. Geographic areas – a shortage of providers for the entire population within an area
2. Population groups – a shortage of providers within an area for a specific high-need population
3. Facilities – health care facilities within an area have a shortage of health professionals to meet their needs
Source:
1 2022-23 National Survey of Children’s Health.
Number of Medical Provider Shortages (SFY 2024)
# of shortages
Primary
121
Medical
84
Dental
107
| # of shortages | |
|---|---|
| Primary | 121 |
| Medical | 84 |
| Dental | 107 |
Source: Health Resources & Services Administration, Health Professional Shortage Areas.
Medicaid/CHIP (FY2024)
37,327
children received behavioral services through Medicaid/CHIP
Source: Nebraska Department of Health and Human Services
Immunizations (2023)
88.4%
of teens were immunized against meningitis caused by types A, C, W, and Y.
67.9%
of teen girls completed their HPV vaccine series.
66.9%
of teens boys completed their HPV vaccine series.
77.7%
of children received their primary immunization series by age 3.
Source: National Center for Immunization and Respiratory Diseases
Children With a Medical Home (2024)
Source: 2023-24 National Survey of Children’s Health.
81.7%
of children had a preventative dental visit in the past year in 2024.
38.0%
of children had one or more current health conditions in 2024.
93.2%
of children are in very good to excellent health in 2024.
78.8%
of children who had a preventative medical visit in the past year in 2024.
Source: 2023-24 National Survey of Children’s Health.
Behavioral Health
Many children in Nebraska deal with behavioral health problems that may affect their ability to participate in normal childhood activities.
The National Survey of Children’s Health estimates the amount of Nebraska children facing the following disorders:
Number of Children Facing Disorders (2024)
Anxiety
38,500
ADD/ADHD
41,866
Depression
17,810
Autism Spectrum Disorder
15,279
| Anxiety | 38,500 |
|---|---|
| ADD/ADHD | 41,866 |
| Depression | 17,810 |
| Autism Spectrum Disorder | 15,279 |
Source: 2023-24 National Survey of Children’s Health
96,503
children with a mental, emotional, developmental or behavioral problem in 2024.1
47.6%
of children needing mental health counseling actually received it in 2022.2
Sources:
1 2023-24 National Survey of Children’s Health.
2 2022 National Survey of Children’s Health.
Children receiving community-based behavioral health services through DHHS (2024)
Mental Health
2,552
Substance Use
27
| Mental Health | 2,552 |
|---|---|
| Substance Use | 27 |
Source: Department of Health and Human Services
Suicides in the last 12 months (2023)
Seriously considered suicide
14.0%
Made a suicide plan
9.6%
Attempted suicide
3.1%
| Seriously considered suicide | 14.0% |
|---|---|
| Made a suicide plan | 9.6% |
| Attempted suicide | 3.1% |
Source: Center for Disease Control and Prevention, Youth Risk Behavior Survey, 2023
Regional centers (2024)
66 youth
received services from Lincoln Regional Center at the Whitehall Campus in 2024.
Source: Department of Health and Human Services.
Children receiving community-based behavioral health services by race/ethnicity (2024)
Source: Department of Health and Human Services
84.0%
of children 6 months to 5 years who met all four measures of flourishing in 2024.1
27.2%
of teens who felt sad or hopeless every day for 2+ weeks so that activity was stopped in 2023.2
Sources:
1 2023-24 National Survey of Children’s Health.
2 Center for Disease Control and Prevention, Youth Risk Behavior Survey, 2023.
Health Risks
47.3%
of high schoolers rarely or never wore a seat belt in 2023.
Source: Center for Disease Control and Prevention, Youth Risk Behavior Survey, 2023
Motor vehicle crashes and seat belt use (2023)
Source: Center for Disease Control and Prevention, Youth Risk Behavior Survey, 2023
Injuries and violence (2023)
Source: Center for Disease Control and Prevention, Youth Risk Behavior Survey, 2023
Blood Lead Level Testing (SFY 2024)
Exposure to lead may harm a child’s brain and central nervous system. Even low blood lead concentrations can cause irreversible damage such as:
- Impaired physical and cognitive development
- Delayed development
- Behavioral problems
- Hearing loss
- Malnutrition
The Centers for Disease Control uses a reference level of five micrograms per deciliter to identify children as having an elevated blood lead level.
723
children had elevated blood lead levels.
36,725
children had a confirmed blood lead level test.
2.0%
of tested children had elevated blood lead levels.
Source: Childhood Lead Poisoning Prevention Program, Nebraska Department of Health and Human Services.
Teen alcohol and other drug use (2023)
In the past 30 days had at least one drink of alcohol
11%
In the past 30 days had 5 or more drinks in a row within a couple of hours
4%
Ever used marijuana
14%
Ever used any form of cocaine
1%
Ever used any form of heroin
1%
Ever used inhalants to get high
3%
Ever used meth
1%
Ever used ecstasy or MDMA
1%
Ever took prescription pain medicine without a doctor’s prescription or differently than how a doctor told them to use it
10%
| In the past 30 days had at least one drink of alcohol | 11% |
|---|---|
| In the past 30 days had 5 or more drinks in a row within a couple of hours | 4% |
| Ever used marijuana | 14% |
| Ever used any form of cocaine | 1% |
| Ever used any form of heroin | 1% |
| Ever used inhalants to get high | 3% |
| Ever used meth | 1% |
| Ever used ecstasy or MDMA | 1% |
| Ever took prescription pain medicine without a doctor’s prescription or differently than how a doctor told them to use it | 10% |
Source: Center for Disease Control and Prevention, Youth Risk Behavior Survey, 2023
Teen tobacco use (2023)
Currently smokes cigarettes
2%
Currently uses smokeless tobacco
2%
Currently uses an electronic vapor product
7%
| Currently smokes cigarettes | 2% |
|---|---|
| Currently uses smokeless tobacco | 2% |
| Currently uses an electronic vapor product | 7% |
Source: Center for Disease Control and Prevention, Youth Risk Behavior Survey, 2023
20
community-based Nebraska’s Network of Domestic Violence/Sexual Assault Programs in 2023.
4
Nebraska Tribal Coalition Ending Family Violence programs in 2023.
Source: Nebraska Coalition to End Sexual and Domestic Violence Annual Report 2023.
Adverse Childhood Experiences
Adverse childhood experiences (ACEs) are potentially traumatic events that can have negative, lasting effects on health and well-being. Experiencing multiple ACEs results in compounding effects, and there is growing evidence that it is the general experience of multiple ACEs, rather than the specific individual impact of any one experience, that matters. The experience of ACEs extends beyond the child and can cause consequences for the whole family and community.
Types of ACEs (2024)
Source: 2023-24 National Survey of Children’s Health
Number of ACEs children experience (2024)
0 ACEs
65.0%
1 ACEs
19.6%
2+ ACEs
15.5%
| 0 ACEs | 65.0% |
|---|---|
| 1 ACEs | 19.6% |
| 2+ ACEs | 15.5% |
Source: 2023-24 National Survey of Children’s Health
Among children with 2 or more ACE, the following were displayed (2024)
Source: 2023-24 National Survey of Children’s Health, Family Health and Activities
Education
Education is the surest way to build a pathway to lifelong success, and the early years of a child’s life are imperative to laying a solid foundation for success. Establishing the conditions that promote educational achievement for children is critical. With a strong and healthy early beginning, children can more easily stay on track to remain in school, graduate on time, pursue postsecondary education and training and enjoy a successful transition into adulthood. Closing gaps in educational access and quality is key to ensuring the future workforce can compete and build or continue the cycle of success and independence.
Child Care
Capacity of Licensed Child Care Facility Per 100 Children Under 6 With All Available Parents Working by County (2024)
Nebraska State Capacity: 83
- No Facilities
- 1-24
- 25-49
- 50-74
- 75-99
- 100+
Note: Does not include School-Age-Only Child Care Centers , Source: Department of Health and Human Services
2,459
total licensed child care facilities in 2024.1
108,771
children under 6 needed child care in 2024.2
14,455
of Nebraska parents of children 0-5 quit, did not take, or greatly changed their job because of child care problems in 2024.3
Source:
1 Department of Health and Human Services.
2 U.S. Census 2024 American Community Survey 5-Year Estimate, Table B23008.
3 2023-24 National Survey of Children’s Health.
Annual child care costs (2024)
Center-Based Care
Infant
$13,042
4-year-old
$11,099
Home-Based Care
Infant
$8,791
4-year-old
$8,391
| Center-Based Care | |
|---|---|
| Infant | $13,042 |
| 4-year-old | $11,099 |
| Home-Based Care | |
| Infant | $8,791 |
| 4-year-old | $8,391 |
Source: Buffett Early Childhood Institute
Child care subsidy (2024)
Average number of children who received a subsidy each month (2023)
Living below 100% FPL
15,429
Between 100% and 130% FPL
11,441
Between 130% and 185% FPL
1,389
Below school-age
12,325
School-age
7,148
All
18,391
| Living below 100% FPL | 15,429 |
|---|---|
| Between 100% and 130% FPL | 11,441 |
| Between 130% and 185% FPL | 1,389 |
| Below school-age | 12,325 |
| School-age | 7,148 |
| All | 18,391 |
Source: Department of Health and Human Services
21,256
children received child care subsidy.
539
children were in the care of license-exempt providers.
Source: Department of Health and Human Services
Funds spent on the child care subsidy program (2024)
State
$53,420,314
Federal
$118,387,155
| State | $53,420,314 |
|---|---|
| Federal | $118,387,155 |
Source: Department of Health and Human Services
Step Up To Quality
Nebraska Step Up to Quality is an Early Childhood Quality Rating and Improvement System (QRIS) passed by the Nebraska Legislature in 2013. The primary goal of Nebraska Step Up to Quality is to improve early care and education quality and increase positive outcomes for young children. This is done through informing parents about quality early care and education programs in understandable and measurable ways. In addition, it improves teacher and director effectiveness through training and professional development, formal education, and coaching. It also emphasizes strengthening the understanding and use of standards, assessment processes, and using data to improve quality.
Step 1: The program has completed the application to participate in Step Up to Quality, staff members have submitted a professional record, and the program director has completed orientation.
Step 2: The program director completed several trainings related to safety, child health and early learning and management as well as several self assessments related to child development knowledge.
Steps 3-5: Once programs achieve Step 2, they are eligible for coaching services. Early childhood coaches help guide programs as they set goals to make program improvements. During the rating process, programs earn points in the following standard areas: curriculum, learning environments & interactions, child outcomes, professional development and training, family engagement & partnerships, and program administration. Steps 3-5 ratings are determined by the number of points achieved.
Nebraska Step Up to Quality Programs by County (2024)
Source: Nebraska Office of Early Childhood Education
932
Step Up to Quality Programs as of 2024.
378
Providers – Step 1
331
Providers – Step 2
223
Providers – Steps 3-5
Source: Nebraska Office of Early Childhood Education
19,316
children were enrolled in public school-based preschool in 2023-24.
Source: Nebraska Department of Education
The Early Development Network (EDN) serves families with children born with disabilities.
2,341
infants and toddlers had an Individualized Family Service Plan through EDN in 2023-24.
Source: U.S. Department of Education, Nebraska State Performance Plan Annual Performance Report, FFY 2023.
Children (birth-age 3) (2022-23)
# of children
With developmental delay
2,320
With speech language impairment
79
With hearing impairment
53
With autism
77
With some other disability
98
| # of children | |
|---|---|
| With developmental delay | 2,320 |
| With speech language impairment | 79 |
| With hearing impairment | 53 |
| With autism | 77 |
| With some other disability | 98 |
Source: Nebraska Department of Education
17
Head Start Programs in 2024
19
Early Head Start Programs in 2024
5,452
children served in Early Head Start/Head Start Programs
9.1%
of families with children served in Early Head Start/Head Start programs experienced homelessness
144
pregnant women served in Early Head Start program
Source: 2024 Office of Head Start Program Information Reports
Public Preschool Enrollment
Source: Nebraska Department of Education
Sixpence serves children birth to age 3 who are at risk of failure in school and is funded through public and private dollars.
51
Sixpence Programs as of 2023-24
1,082
families served by Sixpence Programs
107
pregnant moms served by Sixpence Programs
1,254
children served by Sixpence Programs
Source: Sixpence Early Learning Fund 2023-24 Annual Report
K-12 Student Characteristics
School Membership by Grade (2022-23)
Source: Nebraska Department of Education
3.9%
of Nebraska school students were highly mobile, meaning they enrolled in two or more public schools during the 2022/23 school year. Higher school mobility is correlated with lower achievement.
Special education classification (2021-22)
Source: Nebraska Department of Education
328,649
children were in enrolled in public school in 2023-24.
16.8%
of students were classified as Special Education. (2023-24)
12.8%
of students were classified as High Ability Learners. (2023-24)
Source: Nebraska Department of Education
Number of home school students (exempt school participants)
Source: Nebraska Department of Education
Percent of students who were English Language Learners
Source: Nebraska Department of Education
Free-Reduced Meals
Community Eligibility (2023-24)
Served
Sites
242
Children
70,802
| Served | |
|---|---|
| Sites | 242 |
| Children | 70,802 |
Source: Nebraska Department of Education
Percent of children eligible for free and reduced price school meals (2009-2024)
Source: Nebraska Department of Education
English Language Arts Proficiency
Reading is a fundamental skill that affects learning experiences and school performance of children and teens. The ability to read proficiently translates to a greater likelihood of performing well in other subjects. Children with lower reading achievement are less likely to be engaged in the classroom, graduate high school, and attend college.
Source: Child Trends, Reading Proficiency
3rd Grade
58.9%
of children overall proficient in English Language Arts
44.9%
of low-income children overall proficient in English Language Arts
Source: Nebraska Department of Education
8th Grade
62.8%
of children overall proficient in English Language Arts
48.6%
of low-income children overall proficient in English Language Arts
Source: Nebraska Department of Education
11th Grade
38.4%
of children overall proficient in English Language Arts
43.4%
of low-income children overall proficient in English Language Arts
Source: Nebraska Department of Education
Math Proficiency
Math skills are essential for functioning in everyday life, as well as for future success in our increasingly technical workplace. Students who take higher courses in mathematics are more likely to attend and complete college. Those with limited math skills are more likely to find it difficult to function in everyday society and have lower levels of employability.
Source: Child Trends, Mathematics Proficiency.
5th Grade
61.1%
of children overall proficient in math
45.7%
of low-income children overall proficient in math
Source: Nebraska Department of Education
8th Grade
56.6%
of children overall proficient in math
39.3%
of low-income children overall proficient in math
Source: Nebraska Department of Education
11th Grade
38.4%
of children overall proficient in math
41.9%
of low-income children overall proficient in math
Source: Nebraska Department of Education
Science Proficiency
Proficiency in science helps prepare students to go on to highly skilled professions. Having a strong foundation in the sciences allows students to work in today’s high-demand fields. Students with a greater understanding of sciences learn how to better protect the environment and increase the health and security of people throughout the world.
Source: Child Trends, Science Proficiency
5th Grade
82.6%
of children overall proficient in science
73.9%
of low-income children overall proficient in science
Source: Nebraska Department of Education
8th Grade
65.6%
of children overall proficient in science
51.2%
of low-income children overall proficient in science
Source: Nebraska Department of Education
11th Grade
49.4%
of children overall proficient in science
49.6%
of low-income children overall proficient in science
Source: Nebraska Department of Education
Absences and Career-Readiness
Amount of Students Expelled and Suspended (2023-24)
# of students
% of students
Expelled
763
<1%
Suspended
23,068
6.5%
| # of students | % of students | |
|---|---|---|
| Expelled | 763 | <1% |
| Suspended | 23,068 | 6.5% |
Source: Nebraska Department of Education
Students Absent (2023-24)
Note: Includes public and nonpublic schools.
# of students
% of students
10-19 Days
90,278
26.3%
20-29 Days
24,581
7.2%
30+ Days
22,343
6.5%
| # of students | % of students | |
|---|---|---|
| 10-19 Days | 90,278 | 26.3% |
| 20-29 Days | 24,581 | 7.2% |
| 30+ Days | 22,343 | 6.5% |
Source: Nebraska Department of Education
Career Readiness (2024)
63.5%
of 2023-24 public high school student graduates enrolled in college by April 2025.1
44.6%
of students who enrolled in a 2-year public college in Fall 2017 completed in 6 years.1
69.6%
of students who enrolled in a 4-year public college in Fall 2017 completed within six years.1
2,420
students who enrolled in a career academy. 2
23,773
students who were enrolled in dual credit courses.2
48%
(93,000)
of young people age 18-24 enrolled or have completed college in 2022.3
22,163
students who took the ACT.2
18.7
was the average ACT composite score.2
4%
(5,000) teens 16-19 were not in school and not working.1
9%
(16,000) of people 18 to 24 years old were not attending school, not working, and had no degree beyond high school.1
Sources:
1 National Student Clearinghouse Research Center
2 Nebraska Department of Education.
3 The Annie E Casey Foundation Kids Count Data Center.
Graduation and Educational Savings
4-Year Cohort Graduation Rate (2023-24)
Source: Nebraska Department of Education
21,444
students completed high school in four years.
89.6
2023 extended 5-year graduation rate*
262
16-21 year olds took the GED in 2023-24
85%
of 16-21 year olds successfully completed the GED
Source: Nebraska Department of Education.
*Extended 5th year graduation rate is the percent of students who graduated within five years rather than the standard four.
Nebraska Education Savings Plan Trust (NEST)
(as of December 31, 2024)
In the 2019 Legislative Session, lawmakers approved the Meadowlark Act, which creates a college savings account with an initial seed deposit for every baby born in Nebraska on or after January 1, 2020, in addition to an incentive match payment for college savings contributions made by low-income families. Research shows that similar early investments in educational savings result in improved long-term educational outcomes, particularly for children in lower-income families.
21.5%
of children (under 18) have an Educational Savings Account
103,408
NEST Education Savings Accounts
92,739
NEST accounts funded through the Meadowlark Act
$26,104
is the average value of NEST accounts
Source: Nebraska State Treasurer’s Office
Economic Stability
Our children, communities, and state are stronger when all of Nebraska’s families are able to participate fully in the workforce and establish financial security. We must ensure that families are able to meet their children’s basic needs and achieve financial security. A robust system of supports should help families make ends meet as they work toward financial independence.
Hardworking families should have a fair share in the success of our state’s economy. When families need assistance in meeting the basic needs of their children, public benefit programs should work efficiently and be easy for families to use. Parents should not have to choose between the job they need and the family they love. All families should have the opportunity to invest in their children’s future and be able to access community resources that are well funded by fair tax policies.
Poverty
Nebraska Poverty (2010-2024)
Source: U.S. Census Bureau, 2010-24 American Community Survey 5-year estimate, Table B17001, Table S1702
Family structure and poverty (2024)
33.9%
of children were living in single-mother households and are in poverty.
13.0%
of children were living in single-father households and are in poverty.
5.3%
of children were living in married-couple households and are in poverty.
19.8%
of children were living with a grandparent and are in poverty.
Source: U.S. Census, 2024 American Community Survey 5-year Estimates, Table B17006, S1001.
57,180
children were living in poverty in 2024.1
26,500
children were living in extreme poverty (<50% of the Federal Poverty Line) in 2024.2
Source:
1 U.S. Census Bureau, 2024 American Community Survey 5-year Estimates, Table B17001
2 U.S. Census, 2024 American Community Survey 5-year Estimates, Table B17024
Nebraska poverty rates by race and ethnicity (2024)
Child poverty rate (17 and under)
Overall poverty rate
American Indian
28.4%
21.9%
Asian/Pacific Islander
12.6%
11.1%
Black/African American
36.0%
26.6%
Hispanic
19.9%
16.4%
Multiracial/Other
17.7%
15.4%
White, Not Hispanic
7.0%
8.4%
| Child poverty rate (17 and under) | Overall poverty rate | |
|---|---|---|
| American Indian | 28.4% | 21.9% |
| Asian/Pacific Islander | 12.6% | 11.1% |
| Black/African American | 36.0% | 26.6% |
| Hispanic | 19.9% | 16.4% |
| Multiracial/Other | 17.7% | 15.4% |
| White, Not Hispanic | 7.0% | 8.4% |
Source: U.S. Census Bureau, 2024 American Community Survey 5-year Estimates, Table B17001
2024 Federal poverty level (FPL) guidelines
Federal Poverty Line
Free School Meals
Medicaid Expansion
SNAP
WIC, Reduced Priced Meals, Transitional Child Care Subsidy
Kids Connection (CHIP)
ACA Exchange Tax Credits
# of Persons
100%
130%
138%
165%
185%
213%
400%
1
$15,060
$19,578
$20,783
$24,849
$27,861
$32,078
$60,240
2
$20,440
$26,572
$28,207
$33,726
$37,814
$43,537
$81,760
3
$25,820
$33,566
$35,632
$42,603
$47,767
$54,997
$103,280
4
$31,200
$40,560
$43,056
$51,480
$57,720
$66,456
$124,800
5
$36,580
$47,554
$50,480
$60,357
$67,673
$77,915
$146,320
6
$41,960
$54,548
$57,905
$69,234
$77,626
$89,375
$167,840
7
$47,340
$61,542
$65,329
$78,111
$87,579
$100,834
$189,360
8
$52,720
$68,536
$72,754
$86,988
$97,532
$112,294
$202,240
| Federal Poverty Line | Free School Meals | Medicaid Expansion | SNAP | WIC, Reduced Priced Meals, Transitional Child Care Subsidy | Kids Connection (CHIP) | ACA Exchange Tax Credits | |
|---|---|---|---|---|---|---|---|
| # of Persons | 100% | 130% | 138% | 165% | 185% | 213% | 400% |
| 1 | $15,060 | $19,578 | $20,783 | $24,849 | $27,861 | $32,078 | $60,240 |
| 2 | $20,440 | $26,572 | $28,207 | $33,726 | $37,814 | $43,537 | $81,760 |
| 3 | $25,820 | $33,566 | $35,632 | $42,603 | $47,767 | $54,997 | $103,280 |
| 4 | $31,200 | $40,560 | $43,056 | $51,480 | $57,720 | $66,456 | $124,800 |
| 5 | $36,580 | $47,554 | $50,480 | $60,357 | $67,673 | $77,915 | $146,320 |
| 6 | $41,960 | $54,548 | $57,905 | $69,234 | $77,626 | $89,375 | $167,840 |
| 7 | $47,340 | $61,542 | $65,329 | $78,111 | $87,579 | $100,834 | $189,360 |
| 8 | $52,720 | $68,536 | $72,754 | $86,988 | $97,532 | $112,294 | $202,240 |
Source: HH Poverty Guidelines for 2024; Nebraska Women, Infants, and Children Program; Nebraska Department of Education, Free and Reduced Meals; Nebraska Department of Health and Human Services, Medicaid Expansion, Medicaid, Child Care; Nebraska Supplemental Nutrition Assistance Program; HealthCare.Gov, Premium Tax Credit
Making Ends Meet
Nebraskans pride themselves on being hard-working people. In 2024, 77.6% of children in our state had all available parents in the workforce.1 Unfortunately, having high labor force participation doesn’t always translate into family economic stability.
The chart at right illustrates the gap between low-wage earnings and the amount needed to provide for a two-adult family with two children. It assumes that both adults work full-time (40 hours a week), year-round (52 weeks per year). That means no vacation, no sick time, just work.
1 U.S. Census, 2024 American Community Survey 5-year Estimates, Table B23008
ADC Recipients by Age (2024)
Sources: Financial Services, Operations, Nebraska Department of Health and Human Services. 5. U.S. Census Bureau, Annual Estimates of the Resident Population by Single Year of Age and Sex: April 1, 2020 to July 1, 2024.
Income per Adult for Family of 2 Adults and 2 Children (2024)
Annual
Monthly
Hourly
Minimum Wage
$49,920
$4,160
$12.00
100% Federal Poverty Rate
$31,200
$2,600
$7.50
200% Federal Poverty Rate
$62,400
$5,200
$15.00
| Annual | Monthly | Hourly | |
|---|---|---|---|
| Minimum Wage | $49,920 | $4,160 | $12.00 |
| 100% Federal Poverty Rate | $31,200 | $2,600 | $7.50 |
| 200% Federal Poverty Rate | $62,400 | $5,200 | $15.00 |
Sources: U.S. Department of Labor. HH Poverty Guidelines for 2024.
Aid to Dependent Children (ADC) (2023)
6,271
Average monthly number of children receiving ADC
3,047
Average monthly number of families receiving ADC
$546
Average monthly ADC payment per family
$19,966,262
Total ADC payments (Includes both state and federal funds)
Source: U.S. Census Bureau, Annual Estimates of the Resident Population by Single Year of Age and Sex: April 1, 2020 to July 1, 2024.
Housing & Homelessness
Homelessness
The Nebraska Homeless Assistance Program (NHAP) and the Housing and Urban Development Program (HUD) serve individuals who are experiencing homelessness or nearhomeless. Not all people experiencing homelessness receive services.
In 2024, HUD/NHAP served:
5,063
homeless individuals
1,084
homeless children ages 18 and under
457
homeless families with children
119
unaccompanied homeless children
5,182
individuals at risk of homelessness
2,430
children at risk of homelessness
1,004
families with children at risk of homelessness
119
unaccompanied children at risk of homelessness
Source: Nebraska Center On Children, Families and the Law
Homeownership
Homeownership provides a sense of stability for children and communities.
72.5%
of families with children owned their home in 2024.1
25.3%
of Households were moderately-burdened (30-50% income on rent) by housing costs in 2024.2
21.2%
of Households were severely-burdened (>50% income on rent) by housing costs in 2024.2
Sources:
1 U.S. Census Bureau, 2024 American Community Survey 5-year Estimates, Table B25115.
2 U.S. Census Bureau, 2024 American Community Survey 1-year Estimates, Table B25070.
50,000 (10%)
children lived in crowded housing with more than one person/room in 2023.
19,000 (4%)
children lived in areas of concentrated poverty in 2023.
103,000 (22%)
children lived in households with a high housing burden cost in 2023.
76,000 (53%)
children in low-income households had a high housing cost burden in 2023.
Source: Annie E. Casey Foundation, Kids Count Data Center.
Homeownership Rate (2024)
Source: U.S. Census Bureau, 2024 American Community Survey 5-year Estimates, Table B25003B-I
Hunger
1 in 8
households don’t know where their next meal is coming from in 2024.
Source: U.S. Department of Agriculture, Household Food Security in the United States in 2024.
Approximately 102,743 households in Nebraska were food-insecure in 2024. Food-insecure means that someone in the household has disrupted their eating patterns or reduced their intake of food because there was not enough food in the house to eat.
Number of food-insecure households in Nebraska (2009-2024)
Source: U.S. Department of Agriculture, Household Food Security in the United States in 2024
19.2%
of children experienced food insecurity in 2023.
60%
increase in the number of food-insecure children since 2021.
60%
of food-insecure children were income-eligible for Federal Nutrition Assistance in 2023.
Source: Feeding America, Map the Meal Gap, Child Food Insecurity in Nebraska, 2023.
SNAP & WIC
Supplemental Nutrition Assistance Program
The Supplemental Nutrition Assistance Program (SNAP) is one of the most effective anti-poverty programs in the United States. It provides nutrition assistance to low-income individuals and families through benefits that can be used to purchase food at grocery stores, farmers markets, and other places where groceries are sold.
Source: Characteristics of the Supplemental Nutrition Assistance Program Households.
Percent of SNAP Child Participants (2024)
Source: Nebraska Department of Health and Human Services
Monthly average number of WIC participants (SFY 2024)
All
36,093
Women
7,727
Infants
7,834
Children
20,532
| All | 36,093 |
|---|---|
| Women | 7,727 |
| Infants | 7,834 |
| Children | 20,532 |
Source: Nebraska Department of Health and Human Services
Average number of children enrolled in SNAP (2009-2024)
Source: Nebraska Department of Health and Human Services
The Special Supplemental Nutrition Program for Women, Infants, and Children—known as WIC—aims to improve the health of low-income pregnant, postpartum, and breastfeeding women, infants, and children up to age five who are at nutritional risk. The program provides nutritious foods to supplement diets, information on healthy eating, breastfeeding promotion and support, and referrals to healthcare.
95
clinics provide WIC in SFY 2024
75
counties serve WIC in SFY 2024
$74.73
Average monthly cost per WIC participant in SFY 2024
Source: Nebraska Department of Health and Human Services
Custody
Marriage and divorce (2024)
11,182
married couples
4,893
divorced couples
4,374
children experienced their parents divorcing.
1,470
children in divorce cases were put under their mother’s custody.
241
children in divorce cases were put under their father’s custody.
2,609
children in divorce cases were put under both parent’s custody.
54
children in divorce cases were given a different arrangement.
Source: Nebraska Department of Health and Human Services.
Informal Kinship Care
Child support (SFY 2024) Children are considered to be in informal kinship care if they are not living with a parent or foster parent and are not living independently.
11,000 (2%)
children were living in kinship care in 2023.1
7,846 (3.3%)
grandparent householders were responsible for their own grandchildren under 18 years in 2024.2
Sources:
1 Annie E. Casey Foundation, Kids Count Data Center.
2 U.S. Census Bureau, 2024 American Community Survey 5-year Estimates, Table DP02.
Child support (SFY 2024)
Custodial parents who do not receive child support payments they are owed by non-custodial parents may seek assistance from the Department of Health and Human Services. Assistance is provided by Child Support Enforcement (CSE).
90,378
child support cases that received Child Support Enforcement (CSE) support.
72.3%
of current (any case where obligation is still running) child support cases collected through CSE.
86,644
non-ADC child support cases*
3,734
ADC child support cases*
$202,600,934
of child support was disbursed through CSE.
15,042
cases received services through CSE, but payments were not being made.
1,338
families receiving public benefits which are eligible for and are receiving child support payments.
921
families receiving public benefits which are eligible for child support, but it is not being paid.
3,579
child support cases where non-custodial parent is incarcerated.
$118.66
monthly child support payment per child.
*If the custodial parent is receiving ADC, the state may collect child support from the non-custodial parent as reimbursement. Source: Nebraska Department of Health and Human Services
Source: Nebraska Department of Health and Human Services.
Employment, Income, and Assets
77.6%
of children under 18 with all available parents in the workforce in 2024.
74.1%
of children under 6 that had all available parents in the workforce in 2024.
Source: U.S. Census Bureau, 2024 American Community Survey 5-year Estimates, Table B23008.
Nebraska Unemployment and Underemployment Rate (2009-2024)
Source: U.S. Bureau of Labor Statistics, Alternative Measures of Labor Underutilization for States, Annual Averages, U-3, U-6.
Median Income for Families with Children (2024)
All Families
$99,751
Married Couples
$125,317
Male Householder (No Spouse)
$60,923
Female Householder (No Spouse)
$41,526
| All Families | $99,751 |
|---|---|
| Married Couples | $125,317 |
| Male Householder (No Spouse) | $60,923 |
| Female Householder (No Spouse) | $41,526 |
Source: U.S. Census Bureau, 2024 American Community Survey 5-year Estimates, Table B19126
Median Income for Families by Race & Ethnicity (2024)
Source: U.S. Census Bureau, 2024 American Community Survey 5-year Estimates, Table B19113B-I
Transportation & Taxes
Federal Tax Credits (2024)
109,397
tax returns claimed $284,710,282 in federal Earned Income Tax Credits (EITC).
228,625
families claimed $591,699,514 in federal Child Tax Credits.
46,486
families claimed $28,115,664 in federal Child and Dependent Care Credits.
85,669
families claimed $173,932,633 in additional Child Tax Credit.
Source: Nebraska Department of Revenue.
state Tax Credits (2024)
114,222
tax returns claimed $30,712,635 in state Earned Income Tax Credits (EITC).
46,862
families claimed $8,192,558 in state Child and Dependent Care Credits.
Source: Nebraska Department of Revenue.
42,676
(4.6%)
workers that used transportation other than a personal automobile or carpool to get to work in 2024.1
23,567
(2.3%)
households that had no vehicle available in 2024.2
Sources:
1 U.S. Census Bureau, 2024 American Community Survey 1-year Estimates, Table C08141.
2 U.S. Census Bureau, 2024 American Community Survey 1-year Estimates, Table B08201.
Child Welfare
Keeping our children and youth safe is essential to their healthy development. Children deserve to grow up in safe, permanent, and loving homes. An effective child welfare system works to strengthen families and minimize trauma through timely and appropriate action. Families should be connected to resources in their community that strengthen their abilities to care for their children through a robust network of evidence-based services focusing on child abuse and neglect prevention that are able to meet families where they are. When children do enter the child welfare system, they are entitled to retain ties to their family, culture, and community.
The administration and staff of agencies should reflect the diversity of the populations they serve and work in a way that honors children’s unique heritage and cultural protective factors. Services must be trauma-informed, individualized, timely, and ongoing to maintain safety, well-being, and permanency.
Child Maltreatment
Federal law defines child maltreatment, otherwise known as abuse and neglect, as “any act or failure to act that results in death, serious physical or emotional harm, sexual abuse or exploitation, or any act or failure to act that represents an imminent risk of serious harm.” In Nebraska, the vast majority (85%) of maltreatment is physical neglect, which is a failure to meet a child’s basic needs like food, shelter, and clothing. This is, in many cases, an economic issue.
Why should we be concerned?
Exposure to childhood abuse and neglect hinders children’s healthy social, emotional, and cognitive development. If untreated, toxic stress makes it more likely that children will adopt risky behaviors which negatively impact their future health and success. Given the impacts, we need to strengthen families to prevent abuse and neglect whenever possible, and take swift, thoughtful action to ensure that all children grow up in loving homes.
Child Abuse and Neglect Reports (2024)
43,084
child abuse & neglect reports
15,108
calls were assessed by DHHS and/or law enforcement.
1,592
reports were substantiated.
8,078
reports were unfounded.
3,699
reports were referred to Alternative Response.
Source: Nebraska Department of Health and Human Services.
Safety Assessments (2024)
13,421
safety assessments conducted on children
928
children were determined unsafe.
777
children determined unsafe and referred to court.
122
children determined unsafe and referred to voluntary services.
402
children determined unsafe and non-court involved and family did not elect to participate in voluntary services.
Source: Nebraska Department of Health and Human Services.
Types of Substantiated Maltreatment (2024)
Some children experienced more than one type of maltreatment. The numbers here will be higher than the total number of children who experienced maltreatment. It is important to note that only maltreatment cases that were reported are included in this report. The actual incidence of maltreatment may be higher than what is reported here.
Source: Nebraska Department of Health and Human Services
Child Maltreatment by Age (2024)
Source: Nebraska Department of Health and Human Services
Number of Child Maltreatment Victims per 1,000 Children (2009-2024)
Sources: Nebraska Department of Health and Human Services; U.S. Census Bureau, American Community Survey 1-Year Estimates, Table S0902
3,411
children experienced maltreatment in 2024.
Do you know a child who is being maltreated?
Call the Child Abuse & Neglect Hotline at 1-800-652-1999.
Source: Nebraska Department of Health and Human Services.
Entries & Involvement
How do Children Enter our Child Welfare System? (2011-2024)
Source: Nebraska Department of Health and Human Services
7,909
children were involved in the child welfare system in 2024.
3,960
families were involved in the child welfare system in 2024.
1,181
children entering care in 2024 had previous involvement in the child welfare system.
Children who have any involvement in the child welfare system by age (2024)
Source: Nebraska Department of Health and Human Services
Non-court Entries by Age (2024)
Source: Nebraska Department of Health and Human Services
Court Entries by Age (2024)
Source: Nebraska Department of Health and Human Services
Alternative Response & Tribal Youth
The Omaha Tribe, the Santee Sioux Nation, and the Winnebago Tribe have agreements with the State of Nebraska’s Department of Children and Family Services to provide child welfare services to tribal members within the boundaries of their reservations.
These cases are under the jurisdiction of Tribal Courts and fully managed by the tribes’ child welfare departments. The Tribal Youth data contained on this page are from DHHS and represent the services provided under those agreements.
Number of Tribal Youth (2024)
Involved
525
Entered
91
Placed in out-of-home care
512
Exited
140
| Involved | 525 |
|---|---|
| Entered | 91 |
| Placed in out-of-home care | 512 |
| Exited | 140 |
Source: Nebraska Department of Health and Human Services
Alternative Response
The majority of children who come into Nebraska’s child welfare system are identified because their family is unable to meet their basic needs, which is often related to symptoms of poverty. Alternative Response brings more flexibility to our state response to child maltreatment in certain low- or moderate-risk cases by allowing caseworkers to focus on harnessing the strengths of each family and building parental capacity through intensive supports and services.
3,057
families were served by Alternative Response in 2024.
2,439
families were successfully discharged by Alternative Response.
49
days on average to successful discharge.
719
families changed track from Alternative Response to Traditional Response.
25
days on average of involvement before changing track.
Source: Nebraska Department of Health and Human Services.
Tribal Children Receiving Out-of-home Services by Placement Type (2024)
Adoptive Home
1-5*
Developmental disability facility
28
Detention
12
Emergency Shelter
18
Group Home
27
Hospital/Medical Facility
27
Independent Living
1-5*
Kinship Foster Home
83
Missing Youth
36
Non-relative Foster Home
194
Psychiatric Residential Treatment Facility
1-5*
Relative Foster Home
450
Therapeutic Group Home
7
Youth Rehabilitation and Treatment Center
1-5*
Duplicated Total
894
| Adoptive Home | 1-5* |
|---|---|
| Developmental disability facility | 28 |
| Detention | 12 |
| Emergency Shelter | 18 |
| Group Home | 27 |
| Hospital/Medical Facility | 27 |
| Independent Living | 1-5* |
| Kinship Foster Home | 83 |
| Missing Youth | 36 |
| Non-relative Foster Home | 194 |
| Psychiatric Residential Treatment Facility | 1-5* |
| Relative Foster Home | 450 |
| Therapeutic Group Home | 7 |
| Youth Rehabilitation and Treatment Center | 1-5* |
| Duplicated Total | 894 |
*Exact counts suppressed by Nebraska Department of Health and Human Services due to privacy concerns., Source: Nebraska Department of Health and Human Services
Race & Ethnicity in Child Welfare
Entries to the child welfare system (2024)
Source: Nebraska Department of Health and Human Services.
Child welfare system involvement (2024)
Source: Nebraska Department of Health and Human Services.
Total child population (2024)
Source: U.S. Census Bureau, Annual Estimates of the Resident Population by Age, Sex, Race, and Hispanic Origin for Nebraska: April 1, 2020 to July 1, 2024.
Out-of-home care (2024)
Source: Nebraska Department of Health and Human Services.
Out-of-home care (2024)
Source: Nebraska Department of Health and Human Services.
In-home and out-of-home services (2024)
Source: Nebraska Department of Health and Human Services.
Placements & Staff Cases
Removal Reasons of Children in Out-of-home Care (2024)
Neglect (Alleged/Reported)
3,250
Drug Abuse (Parent/Caretaker)
1,291
Physical Abuse (Alleged/Reported)
808
Inadequate Housing
517
Domestic Violence
633
Alcohol Abuse (Parent/Caretaker)
476
Incarceration of Parent(s)/Caretaker(s)
416
Sexual Abuse (Alleged/Reported)
279
Child’s Behavior Problems
291
Abandonment
283
Parent’s/Caretaker’s Inability to Cope Due to Illness/Other
93
Homelessness
159
Education Neglect
125
Medical Neglect
113
Psychological and Emotional Abuse
61
Prenatal Drug Exposure
87
Death of Parent(s)/Caretaker(s)
54
Parent’s/Caretaker’s Significant Impairment Physical/Emotional
45
Mentally Ill and Dangerous (Child)
36
Inadequate Access to Mental Health Services
15
Drug Abuse (Child)
15
Parent’s/Caretaker’s Significant Impairment Cognitive
24
Whereabouts Unknown
25
Court Determined that Reasonable Efforts are not Required.
15
Runaway
15
Diagnosed Child’s Disability
13
Alcohol Abuse (Child)
17
Inadequate Access to Medical Health Services
15
Human Trafficking
7
Voluntary Relinquishment for Adoption
8
Child/Young Adult Requests Placement
8
Failure to Return
9
Prenatal Alcohol Exposure
11
Safe Haven
2
Conflict Related to Child’s Sexual Orientation or Gender ID
2
Parental Immigration Detainment or Deportation
3
Sex Trafficking
1
| Neglect (Alleged/Reported) | 3,250 |
|---|---|
| Drug Abuse (Parent/Caretaker) | 1,291 |
| Physical Abuse (Alleged/Reported) | 808 |
| Inadequate Housing | 517 |
| Domestic Violence | 633 |
| Alcohol Abuse (Parent/Caretaker) | 476 |
| Incarceration of Parent(s)/Caretaker(s) | 416 |
| Sexual Abuse (Alleged/Reported) | 279 |
| Child’s Behavior Problems | 291 |
| Abandonment | 283 |
| Parent’s/Caretaker’s Inability to Cope Due to Illness/Other | 93 |
| Homelessness | 159 |
| Education Neglect | 125 |
| Medical Neglect | 113 |
| Psychological and Emotional Abuse | 61 |
| Prenatal Drug Exposure | 87 |
| Death of Parent(s)/Caretaker(s) | 54 |
| Parent’s/Caretaker’s Significant Impairment Physical/Emotional | 45 |
| Mentally Ill and Dangerous (Child) | 36 |
| Inadequate Access to Mental Health Services | 15 |
| Drug Abuse (Child) | 15 |
| Parent’s/Caretaker’s Significant Impairment Cognitive | 24 |
| Whereabouts Unknown | 25 |
| Court Determined that Reasonable Efforts are not Required. | 15 |
| Runaway | 15 |
| Diagnosed Child’s Disability | 13 |
| Alcohol Abuse (Child) | 17 |
| Inadequate Access to Medical Health Services | 15 |
| Human Trafficking | 7 |
| Voluntary Relinquishment for Adoption | 8 |
| Child/Young Adult Requests Placement | 8 |
| Failure to Return | 9 |
| Prenatal Alcohol Exposure | 11 |
| Safe Haven | 2 |
| Conflict Related to Child’s Sexual Orientation or Gender ID | 2 |
| Parental Immigration Detainment or Deportation | 3 |
| Sex Trafficking | 1 |
Note: Children may have more than one reason for removal. *Number is suppressed due to privacy protection
5,499
children received out-of-home services in 2024 and had a 3(A) petition.
Children Receiving In-home Services by Age (2024)
Source: Nebraska Department of Health and Human Services
Children Receiving Out-of-Home Services by Age (2024)
Source: Nebraska Department of Health and Human Services
Total Staff Caseloads in Compliance (12/31/2024)
Service Area
Total Staff
Staff With Caseloads In Compliance
Percent of Caseloads In Compliance
Central
55
52
94.5%
Eastern
169
114
67.5%
Northern
71
61
85.9%
Southeast
98
91
92.9%
Western
60
55
91.7%
State
451
373
82.7%
Compliance as reported by DHHS and determined by the Child Welfare League of America. There are multiple factors influencing caseload including urban or rural, initial assessment, in-home or out-of-home, and court or non-court involvement.
| Service Area | Total Staff | Staff With Caseloads In Compliance | Percent of Caseloads In Compliance |
|---|---|---|---|
| Central | 55 | 52 | 94.5% |
| Eastern | 169 | 114 | 67.5% |
| Northern | 71 | 61 | 85.9% |
| Southeast | 98 | 91 | 92.9% |
| Western | 60 | 55 | 91.7% |
| State | 451 | 373 | 82.7% |
Source: Nebraska Department of Health and Human Services
Out-of-Home Placements
When children must be removed from their homes, it is important to ensure that their placement reduces the trauma of removal and promotes the well-being of the child. Congregate care, which places children in an institutional setting such as a group home or detention center, should be used minimally for out-of-home placements.
Research shows that placement in a family-like setting provides children with improved long-term outcomes in physical and emotional health. Although congregate care may be necessary for some children, for many others, it does not allow children to maintain the strong relationships with trusted adults that are essential for successful development.
There are three types of foster parents in Nebraska:
Relative foster homes: Foster parents who are related to the child or children whom they care for by blood, marriage, or adoption.
Kinship foster homes: Foster parents who have a significant pre-existing relationship with the child or children for whom they care. (Ex: former teacher, coach, or neighbor.)
Licensed foster homes: Foster parents who live at the licensed residence and care for a child or children who they have not previously known.
Foster Home Placement Beds (12/31/2024)
# of Beds Available
# of Homes Available
Foster Homes
4,788
2,330
Approved Foster Homes
1,312
811
Licensed Foster Homes
3
1,519
| # of Beds Available | # of Homes Available | |
|---|---|---|
| Foster Homes | 4,788 | 2,330 |
| Approved Foster Homes | 1,312 | 811 |
| Licensed Foster Homes | 3 | 1,519 |
Source: Nebraska Department of Health and Human Services
1,861
(54.2%)
children in foster care were placed with relatives or kin.
2,033
kids in out-of-home care also had a sibling in out-of-home care.
49.2%
of children were placed with relatives or kin.
33.0%
of foster home beds were in kin or relative homes.
2,033
kids in out-of-home care also had a sibling in out-of-home care.
62.9%
of children were placed in out-of-home care with all siblings.
80.0%
of children were placed in out-of-home care with at least one sibling.
Source: Nebraska Department of Health and Human Services.
Where are the kids in out-of-home care? (12/31/2024)
#
%
Adoptive Home
81
2.6%
Relative Home
1,091
34.4%
Kinship Care
468
14.8%
Non-Relative Foster Home
1,045
33.0%
Group Home
33
1.0%
Developmental Disability Facility
177
5.6%
Detention Facility
31
1.0%
Emergency Shelter Center
24
0.8%
Psychiatric Residential Treatment Facility
31
1.0%
Independent Living
58
1.8%
Hospital
11
0.3%
Missing Youth
27
0.9%
Therapeutic Group Home
2
0.1%
Youth Rehabilitation and Treatment Center
91
2.9%
| # | % | |
|---|---|---|
| Adoptive Home | 81 | 2.6% |
| Relative Home | 1,091 | 34.4% |
| Kinship Care | 468 | 14.8% |
| Non-Relative Foster Home | 1,045 | 33.0% |
| Group Home | 33 | 1.0% |
| Developmental Disability Facility | 177 | 5.6% |
| Detention Facility | 31 | 1.0% |
| Emergency Shelter Center | 24 | 0.8% |
| Psychiatric Residential Treatment Facility | 31 | 1.0% |
| Independent Living | 58 | 1.8% |
| Hospital | 11 | 0.3% |
| Missing Youth | 27 | 0.9% |
| Therapeutic Group Home | 2 | 0.1% |
| Youth Rehabilitation and Treatment Center | 91 | 2.9% |
* Data suppressed. Source: Nebraska Department of Health and Human Services
Placement Stability
Multiple Placements
The Nebraska Department of Health and Human Services counts placement changes when a child moves from one foster care setting to another. Children in stable homes are reported to receive more attention, acceptance, affection, and better care from their foster parents. Children who are in stabilized homes are more likely to receive therapy, are less delinquent and oppositional/aggressive, and are more likely to be placed with competent and caring foster parents.
Source: University of Illinois, Child and Family Research Center, Placement Stability Study, 1999.
Average number of out-of-home placements by age (2024)
Source: Nebraska Department of Health and Human Services
Average number of out-of-home placements by race/ethnicity (2024)
Source: Nebraska Department of Health and Human Services
1,597
children exited out-of-home care in 2024.
25.8 months
is the mean length of time away from home for children in out-of-home placement in 2024.
Source: Nebraska Department of Health and Human Services.
Length of time in out-of-home care (months)(2024)
Source: Nebraska Department of Health and Human Services
Permanency
Exiting the System
Once in the child welfare system, children should be on a track toward achieving permanency in a safe, loving environment. Most of the time, that means they will be reunified with their family and return home. Other times, permanency may be achieved through adoption or guardianship.
Exits from out-of-home care (2011-2024)
Source: Nebraska Department of Health and Human Services
1,326
non-court-involved children exited the system in 2024.
2,196
court-involved children exited the system in 2024.
201
children exited into guardianships in 2024.
194
children exited into guardianships which were subsidized in 2024.
490
children were adopted in 2024.
477
adoptions were subsidized in 2024.
24.7 months
is the mean length of time from termination of parental rights until adoption in 2024.
Source: Nebraska Department of Health and Human Services.
Aging Out
Family support is key to any successful transition into adulthood, especially for youth who may have been exposed to trauma. Learning to be self-reliant in seeking employment and housing, managing finances, or seeking healthcare can be daunting without family connections. For youth who have been in foster care who do not exit the system to a family, ensuring a strong system of support in this transition is key. The Bridge to Independence (B2i) program works to address this issue. B2i serves youth who must be either working, seeking work, or are in school. In return, they receive Medicaid coverage, a monthly stipend to use for living expenses, and an assigned caseworker on call 24/7 to help them navigate the transition to adulthood.
Youth who were in out-of-home care when they reached their 19th birthday (2024)
Total
178
Who were DHHS wards
169
Who were OJS wards (youth placed at YRTC)
*
Who were in (both)
*
| Total | 178 |
|---|---|
| Who were DHHS wards | 169 |
| Who were OJS wards (youth placed at YRTC) | * |
| Who were in (both) | * |
Source: Nebraska Department of Health and Human Services. *Data suppressed due to privacy protection.
Reasons for participation in the Bridge to Independence Program (2024)
Source: Nebraska Department of Health and Human Services
Bridge to independence program (2024)
84
young adults in the Bridge to Independence Program were parenting or pregnant in 2024.
389
young adults participated in the program.
201
young adults entered the program.
160
young adults left the program.
5
young adults chose to leave the voluntary services program.
33
young adults left the program due to lack of cooperation with the voluntary program.
6
young adults left the program because housing could not be approved.
89
young adults successfully completed the B2i Program.
*Data suppressed due to privacy protection.
Source: Nebraska Department of Health and Human Services.
Juvenile Justice
Keeping our children and youth safe is essential to their healthy development. Youth should be held accountable for their actions in developmentally appropriate ways that promote community safety and allow them to grow into responsible citizens.
When youth act out, they should be held accountable primarily by families, schools, and communities, avoiding contact with the juvenile justice system if at all possible. Youth entering and already in the juvenile justice system are entitled to be safe, and their rights must be respected. Retaining strong connections to family, community, and culture help youth thrive within the system. The juvenile justice system should be rehabilitative in nature and designed specifically for youth.
Arrests
Youth arrests (2024)
Type
Male
Female
Total
% of Total
Curfew
37
17
54
0.8%
Alcohol
289
220
509
7.1%
Drug-Related
410
192
602
8.4%
Violent
195
55
250
3.5%
Person
1,107
770
1,877
26.2%
Property
1,470
680
2,150
30.1%
Public Order
232
161
393
5.5%
Weapon
115
5
120
1.7%
Other
748
344
1,092
15.3%
DUI
76
31
107
1.5%
Total
4,679
2,475
7,154
| Type | Male | Female | Total | % of Total |
|---|---|---|---|---|
| Curfew | 37 | 17 | 54 | 0.8% |
| Alcohol | 289 | 220 | 509 | 7.1% |
| Drug-Related | 410 | 192 | 602 | 8.4% |
| Violent | 195 | 55 | 250 | 3.5% |
| Person | 1,107 | 770 | 1,877 | 26.2% |
| Property | 1,470 | 680 | 2,150 | 30.1% |
| Public Order | 232 | 161 | 393 | 5.5% |
| Weapon | 115 | 5 | 120 | 1.7% |
| Other | 748 | 344 | 1,092 | 15.3% |
| DUI | 76 | 31 | 107 | 1.5% |
| Total | 4,679 | 2,475 | 7,154 |
Source: Nebraska Crime Commission
Number of youth arrests (2009-2024)
Source: Nebraska Crime Commission; Douglas County Juvenile Justice Initiative
7,154
youths were arrested in 2024.2
30.1%
property crimes were the most common.1
Sources:
1 Nebraska Crime Commission
2 Nebraska Crime Commission; Douglas County Juvenile Justice Intiative.
Status Offenses
“Status offenses” are non-criminal behaviors, like skipping school, that could not be charged but for the “status” of being a minor.
Youth arrests by race/ ethnicity (2024)
Source: Nebraska Crime Commission; Douglas County Juvenile Justice Initiative
Disproportionate Minority Contact
Despite the promise of equal protection under the law, national research shows that youth of color are overrepresented in the juvenile justice system. This overrepresentation often is a product of decisions made at early points of contact with the juvenile justice system. Where racial differences are found to exist, they tend to accumulate as youth are processed deeper into the system.1
Unfortunately, our juvenile justice system lacks uniform ways of collecting data on race and ethnicity. Although disparities exist across system points, different agencies have different ways of counting Hispanic youth in particular. Additional information on the race and ethnicity of youth arrested, on probation, and in adult prison are available elsewhere in this section.
Source:
1 “And Justice for Some: Differential Treatment of Youth of Color in the Juvenile Justice System,” National Council on Crime and Delinquency, (January 2007).
Youth interaction with the justice system by race/ethnicity (2024)
Sources:
1 U.S. Census Bureau, Population Division, Annual State Resident Population Estimates for 6 Race Groups (5 Race Alone Groups and Two or More Races) by Age, Sex, and Hispanic Origin: April 1, 2020 to July 1, 2024.
2 Nebraska Juvenile Justice System, Statistical Annual Report 2024.
3 Analysis based on data from individual facilities including Lancaster County Detention Center, Northeast Nebraska Juvenile Services, Douglas County Youth Center, and The Patrick J. Thomas Juvenile Justice Center.
4 Nebraska Crime Commission, Juvenile Diversion in Nebraska 2024 Annual Report.
5 Department of Health and Human Services.
Pre-Trial Diversion
Juvenile Diversion Program
Pretrial diversion programs are based on the belief that many juvenile cases are better handled outside of the courthouse doors. These voluntary programs are designed to provide eligible youth an opportunity to demonstrate rehabilitation and make things right with the community, while reducing the cost and burden to taxpayers and courts that come with formal charges being filed. By successfully completing his or her diversion plan, a minor has the opportunity to avoid formal charges in the court and get all record of the matter sealed. By diverting these cases from the court system, counties save significant dollars, making successful diversion programs a win-win.
3,572
youths were referred to the diversion program in 2024.
2,367
youths successfully completed diversion in 2024.
88
counties participated in the diversion program in 2024.
0
tribes participated in the diversion program in 2024.
343
of those referred did not participate in 2024.
504
youths did not complete diversion successfully and were discharged for failing to comply or for a new law violation in 2024.
Source: Nebraska Crime Commission, Juvenile Diversion in Nebraska 2024 Annual Report.
Most common law violations referred to diversion (2024)
# of children
Assault
614
Alcohol offenses
541
Shoplifting
487
Truancy
440
Traffic offenses
332
Drug offenses
453
Criminal mischief
239
Disorderly conduct
208
Trespassing
198
Tobacco use by minor
151
Disturbing the peace
131
Other theft offenses
115
Obstructing police
100
| # of children | |
|---|---|
| Assault | 614 |
| Alcohol offenses | 541 |
| Shoplifting | 487 |
| Truancy | 440 |
| Traffic offenses | 332 |
| Drug offenses | 453 |
| Criminal mischief | 239 |
| Disorderly conduct | 208 |
| Trespassing | 198 |
| Tobacco use by minor | 151 |
| Disturbing the peace | 131 |
| Other theft offenses | 115 |
| Obstructing police | 100 |
Source: Nebraska Crime Commission, Juvenile Diversion in Nebraska 2024 Annual Report
Community-based juvenile services aid program
(2024)
Funded through the Community-Based Juvenile Services Aid Program:
144
programs
82
counties
0
tribes
9
prevention/promotion event programs
128
direct intervention programs
4
direct service programs
12
system improvement programs
Source: Nebraska Crime Commission, Community-Based Juvenile Services Aid Program Annual Report 2023.
Juvenile Court Cases
Percent of new court filings by age (2024)
Source: Nebraska Juvenile Justice System, Statistical Annual Report 2023.
Percent of new court filings by gender (2024)
Source: Nebraska Juvenile Justice System, Statistical Annual Report 2023.
Number of new juvenile court filings by race/ethnicity (2024)
Traffic Offense
Status Offense
Misdemeanor
Felony
American Indian
0
0%
16
2.3%
40
1.5%
11
1.8%
Asian/Pacific Islander
0
0%
8
1.1%
25
1.0%
12
2.0%
Black/African American
3
2.4%
56
8.0%
454
17.5%
165
27.0%
Hispanic
34
27.2%
131
18.8%
374
14.5%
77
12.6%
White
65
52.0%
254
36.4%
921
35.6%
172
28.2%
Other
0
0.0%
2
0.3%
7
0.3%
1
0.2%
Unknown
23
18.4%
231
33.1%
766
29.6%
172
28.2%
Total adjudicated as “admit”*
125
76.0%
698
50.0%
2,587
56.3%
610
55.2%
| Traffic Offense | Status Offense | Misdemeanor | Felony | |||||
|---|---|---|---|---|---|---|---|---|
| American Indian | 0 | 0% | 16 | 2.3% | 40 | 1.5% | 11 | 1.8% |
| Asian/Pacific Islander | 0 | 0% | 8 | 1.1% | 25 | 1.0% | 12 | 2.0% |
| Black/African American | 3 | 2.4% | 56 | 8.0% | 454 | 17.5% | 165 | 27.0% |
| Hispanic | 34 | 27.2% | 131 | 18.8% | 374 | 14.5% | 77 | 12.6% |
| White | 65 | 52.0% | 254 | 36.4% | 921 | 35.6% | 172 | 28.2% |
| Other | 0 | 0.0% | 2 | 0.3% | 7 | 0.3% | 1 | 0.2% |
| Unknown | 23 | 18.4% | 231 | 33.1% | 766 | 29.6% | 172 | 28.2% |
| Total adjudicated as “admit”* | 125 | 76.0% | 698 | 50.0% | 2,587 | 56.3% | 610 | 55.2% |
*Note: The data provider recording a case being adjudicated as “admit” means that it has been accepted to be true. Source: Nebraska Juvenile Justice System, Statistical Annual Report 2023.
Access to Counsel
Juvenile Access to Counsel
Having an attorney present during proceedings in the juvenile justice system is not only important for youth but a guaranteed constitutional right. The right to counsel is also enshrined in Nebraska statute 43-272(1). The law is meant to protect children at every stage of legal proceedings and requires the court to advise youth, along with their parents, of their right to an attorney and that legal counsel can be provided at no cost if they are unable to afford it.
46.5%
of children in adult criminal court had an attorney in 2024.
74.5%
of children in juvenile court had an attorney in 2024.
Source: Nebraska Juvenile Justice System, Statistical Annual Report 2022.
Youth in juvenile court with access to counsel by age, gender, and race/ethnicity (2024)
Source: Nebraska Juvenile Justice System, Statistical Annual Report 2024
Percent of youth in juvenile court who had access to counsel by county (2024)
- No Data Available
- No juvenile court cases
- 0.0-19.9%
- 20.0-39.9%
- 40.0-59.9%
- 60.0-79.9%
- 80.0-100%
Source: Nebraska Juvenile Justice System, Statistical Annual Report 2024
Probation
Cost of services funded by probation (2024)
Monthly Average per Youth
Total
$1,416
In-Home Services
$336
Out-of-Home Services
$2,604
| Monthly Average per Youth | |
|---|---|
| Total | $1,416 |
| In-Home Services | $336 |
| Out-of-Home Services | $2,604 |
Source: Administrative Office of the Courts and Probation.
Youth supervised on probation by age, gender, and race/ethnicity (2024)
Source: Administrative Office of the Courts and Probation
4,265
youth were supervised on probation in 2024.
762
had felony offenses
2,725
had misdemeanor, infraction, traffic or city ordinance offenses
778
had status offenses
2,349
were discharged
Source: Administrative Office of the Courts and Probation
Average caseload of juvenile probation officer (2024)
Urban
Rural
High-risk/ high-need intervention
15
16
Low-risk/ low-need intervention
24
23
| Urban | Rural | |
|---|---|---|
| High-risk/ high-need intervention | 15 | 16 |
| Low-risk/ low-need intervention | 24 | 23 |
Source: Administrative Office of the Courts and Probation.
Mean length of time on probation (2024)
10.9 months
Total
10.1 months
for status offenses
14.5 months
for felonies
10.0 months
for misdemeanors/ infractions
Youth in Out-of-Home Care
Out-of-home care of probation youth by placement type and average length of stay (2024)
Source: Nebraska Administrative Office of the Courts & Probation
1,517
youth were supervised on probation who were placed in out-of-home care in 2024.
3.0 months
was the mean length of time in out-of-home care in 2024.
Youth on probation in out-of-home care (2024)
#
%
American Indian
105
7%
Asian/Pacific Islander
45
3%
Black/African American
460
30%
Other
189
12%
White
718
47%
Hispanic
349
23%
Non-Hispanic
1,168
77%
Male
1,069
70%
Female
448
30%
Status Offenses*
96
6%
Felonies*
762
50%
Misdemeanors/infractions/city ordinance offenses*
659
43%
Total
1,517
| # | % | |
|---|---|---|
| American Indian | 105 | 7% |
| Asian/Pacific Islander | 45 | 3% |
| Black/African American | 460 | 30% |
| Other | 189 | 12% |
| White | 718 | 47% |
| Hispanic | 349 | 23% |
| Non-Hispanic | 1,168 | 77% |
| Male | 1,069 | 70% |
| Female | 448 | 30% |
| Status Offenses* | 96 | 6% |
| Felonies* | 762 | 50% |
| Misdemeanors/infractions/city ordinance offenses* | 659 | 43% |
| Total | 1,517 |
*If a youth had an offense in more than one adjudication type, they will be counted by the youth’s highest or most serious offense. Source: Nebraska Administrative Office of the Courts & Probation
Detention
Number of youth held in juvenile dentention facilities (2024)
| Lancaster County Detention Center (Lancaster County) | Northeast Nebraska Juvenile Services (Madison County) | Douglas County Youth Center (Douglas County) | Patrick J. Thomas Juvenile Justice Center (Sarpy County) | |||||
| # | % | # | % | # | % | # | % | |
| Age | ||||||||
| 12 & Under | 0 | 0% | 0 | 0% | 11 | 1.9% | 0 | 0% |
| 13-14 | 33 | 17.7% | 60 | 19.7% | 109 | 18.8% | 26 | 29.5% |
| 15-16 | 104 | 55.9% | 154 | 50.7% | 276 | 47.7% | 47 | 53.4% |
| 17+ | 49 | 26.3% | 90 | 29.6% | 183 | 31.6% | 15 | 17.0% |
| Race/Ethnicity | ||||||||
| American Indian/ Alaska Native | 9 | 4.9% | 34 | 11.2% | 13 | 2.2% | 5 | 5.7% |
| Asian/Pacific Islander | 2 | 1.1% | 1 | 0.3% | 33 | 5.7% | 2 | 2.3% |
| Black/African American | 80 | 43.7% | 23 | 7.6% | 305 | 52.7% | 16 | 18.2% |
| Hispanic | 30 | 16.4% | 86 | 28.3% | 94 | 16.2% | 20 | 22.7% |
| Other | 2 | 1.1% | 0 | 0% | 2 | 0.3% | 2 | 2.3% |
| White, Non-Hispanic | 60 | 32.8% | 160 | 52.6% | 132 | 22.8% | 43 | 48.9% |
| Gender | ||||||||
| Male | 133 | 71.5% | 218 | 71.7% | 456 | 78.8% | 67 | 76.1% |
| Female | 53 | 28.5% | 86 | 28.3% | 123 | 21.2% | 21 | 23.9% |
| Times Detained | ||||||||
| 1 | 137 | 73.7% | 251 | 82.6% | 445 | 76.9% | 70 | 79.5% |
| 2 | 34 | 18.3% | 33 | 10.9% | 106 | 18.3% | 13 | 14.8% |
| 3+ | 15 | 8.1% | 20 | 6.6% | 28 | 4.8% | 5 | 5.7% |
| Total Count | 186 | 304 | 579 | 88 | ||||
| Secure Admissions | 186 | 184 | 579 | 0 | ||||
| Staff Secure Admissions | 0 | 120 | 0 | 88 | ||||
| Average Days Detained | 42.8 days | 25.0 days | 43.1 days | 24.0 days |
Juvenile detention admissions (2014-2024)
Source: Individual detention centers.
Youth Rehabilitation and Treatment Centers (YRTCs) SFY 2024
Hastings
Lincoln
Kearney
Number admitted for treatment
31 youth
8 admissions, 19 transfers
79 youth
Average daily population
13 youth
12 youth
62 youth
Average length of stay
6.4 months
5.2 months
8.5 months
Average age of admission
17 years
16 years
17 years
Average per diem cost per youth
$1,476
$2,079
$789
% return to facility in 12 months
23.0%
14.0%
17.0%
| Hastings | Lincoln | Kearney | |
|---|---|---|---|
| Number admitted for treatment | 31 youth | 8 admissions, 19 transfers | 79 youth |
| Average daily population | 13 youth | 12 youth | 62 youth |
| Average length of stay | 6.4 months | 5.2 months | 8.5 months |
| Average age of admission | 17 years | 16 years | 17 years |
| Average per diem cost per youth | $1,476 | $2,079 | $789 |
| % return to facility in 12 months | 23.0% | 14.0% | 17.0% |
Source: Office of Juvenile Servies, Annual Legislative Report SFY2024
YRTC admissions (2011-2024)
Source: Office of Juvenile Services, Annual Legislative Report SFY 2024
Room Confinement (SFY 2024)
Total incidents
Total youth involved
Median duration of room confinement incidents (hours)
Percent of incidents ending in 4 hours or less
Percent of incidents lasting between 4 and 8 hours
Percent of incidents lasting more than 8 hours
Most common reason for room confinement
Nebraska Corrections Youth Facility
85
17
48
34.0%
8.0%
58.0%
Modified Operations (35%)
YRTC - Kearney
3,050
153
10
72.0%
9.0%
19.0%
Refuse to comply (71%)
YRTC - Lincoln
352
55
20
38.0%
6.0%
56.0%
Danger to other youth (56%)
YRTC - Hastings
108
36
14
48.0%
9.0%
28.0%
Danger to other youth (43%)
Douglas County Youth Center
466
75
146
10.0%
1.0%
3.0%
Fighting (47%)
Lancaster County Youth Services Center
1,760
83
5
61.0%
28.0%
11.0%
Danger to other youth (47%)
Northeast Nebraska Juvenile Services
27
20
10
78.0%
11.0%
11.0%
Danger to other youth (82%)
Patrick J. Thomas Juvenile Justice Center
39
21
3
74.0%
26.0%
0%
Danger to other youth (83%)
| Total incidents | Total youth involved | Median duration of room confinement incidents (hours) | Percent of incidents ending in 4 hours or less | Percent of incidents lasting between 4 and 8 hours | Percent of incidents lasting more than 8 hours | Most common reason for room confinement | |
|---|---|---|---|---|---|---|---|
| Nebraska Corrections Youth Facility | 85 | 17 | 48 | 34.0% | 8.0% | 58.0% | Modified Operations (35%) |
| YRTC - Kearney | 3,050 | 153 | 10 | 72.0% | 9.0% | 19.0% | Refuse to comply (71%) |
| YRTC - Lincoln | 352 | 55 | 20 | 38.0% | 6.0% | 56.0% | Danger to other youth (56%) |
| YRTC - Hastings | 108 | 36 | 14 | 48.0% | 9.0% | 28.0% | Danger to other youth (43%) |
| Douglas County Youth Center | 466 | 75 | 146 | 10.0% | 1.0% | 3.0% | Fighting (47%) |
| Lancaster County Youth Services Center | 1,760 | 83 | 5 | 61.0% | 28.0% | 11.0% | Danger to other youth (47%) |
| Northeast Nebraska Juvenile Services | 27 | 20 | 10 | 78.0% | 11.0% | 11.0% | Danger to other youth (82%) |
| Patrick J. Thomas Juvenile Justice Center | 39 | 21 | 3 | 74.0% | 26.0% | 0% | Danger to other youth (83%) |
Source: Juvenile Room Confinement in Nebraska, 2023-24 Annual Report, Inspector General of Child Welfare
Research associates room confinement with serious consequences for mental and physical health including: – “Increased risk of self-harm and suicidal ideation; – Greater anxiety, depression, sleep disturbances, paranoia, and aggression; Exacerbation of the on-set of pre-existing mental illness and trauma symptoms; and, Increased risk of cardiovascular-related health problems.”1 Regulations, policies, and practices on when, how, and why juvenile room confinement is used differ among types of facilities.
Room confinement should be used as the absolute last resort and only in cases of threats of safety to the individual or other residents and only after other interventions have failed. Room confinement should be timelimited; the youth should be released as soon as they are safely able and should never last longer than 24 hours. During confinement, the youth should be closely monitored and seen by mental health professionals. All instances of room confinement should be recorded and reviewed.
Source: Haney, C. The Psychological Impact of Incarceration on Post-Prison Adjustment. Prison to Home: The Effect of Incarceration and Reentry on Children, Families, and Communities, 2001.
Youth Treated as Adults
286
youth were prosecuted in adult courts in 2024.
This is down from
2,019
in 2014.
Source: Nebraska Judicial Branch, Juvenile Justice System Statistical Annual Report 2024.
Youth prosecuted in adult criminal courts by case type (2024)
Total Youth
286
Traffic
22.7%
Misdemeanor
42.7%
Felony
34.6%
| Total Youth | 286 |
|---|---|
| Traffic | 22.7% |
| Misdemeanor | 42.7% |
| Felony | 34.6% |
Source: Nebraska Judicial Branch, Juvenile Justice System Statistical Annual Report 2024
A motion to transfer from juvenile court to adult court in 2024 was:
Requested in
70 cases
Granted in
8 cases
A motion to transfer from adult court to juvenile court in 2024 was:
Requested in
95 cases
Granted in
72 cases
Source: Nebraska Judicial Branch, Juvenile Justice System Statistical Annual Report 2023.
An age-appropriate response
Research consistently indicates that treating children as adults neither acts as a deterrent, nor does it prevent crime or reduce violence. Instead, prosecution in adult court exposes youth to more risks and delays or prevents treatment and can burden them with permanent records which may act as barriers to future education and employment opportunities. Nebraska law requires that all children age 17 or younger charged with a misdemeanor or low-level felony must have their cases originate in juvenile court. This means that many more children are now receiving the benefit of speedy access to treatment services, a developmentally-appropriate court process aimed at rehabilitation, and the potential to have their records sealed to set them up for a brighter future.
youth in adult prisons and jails (2023)
76
Male
0
Female
5
youth (18 and under) were held in a Nebraska correctional facility for safekeeping reasons or waiting assessment.
71
youth were sentenced to a Nebraska prison.
Source: Nebraska Department of Health and Human Services.
Youth incarcerated in correctional facilities by race/ethnicity (2023)
Source: Nebraska Department of Health and Human Services